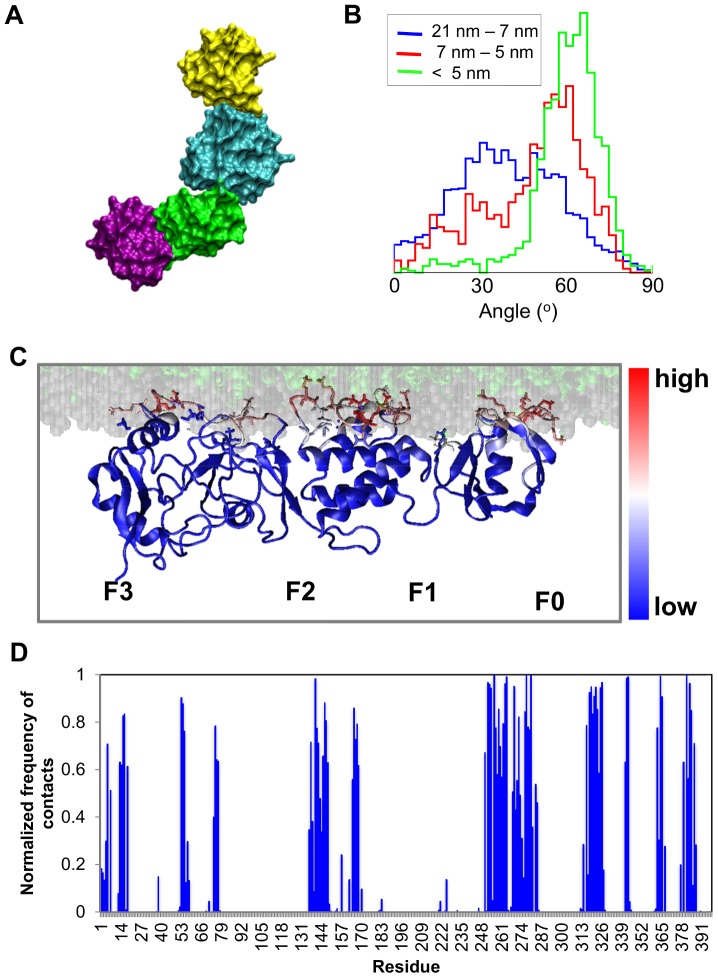
Figure 4. Simulation of the association of talin with a lipid bilayer (tal-h2F0-CG; seeTable 1).
A. Final snapshot from the tal-h2F0-CG simulation, illustrating how the F0–F1 pair (purple-green) has been displaced relative to the F2–F3 pair (cyan-yellow) resulting in a V-shaped conformation. B. Change in the angle between the F0–F1 and the F2–F3 domain pairs as a function of distance from the bilayer during the tal-h2F0-CG simulation. The diagram shows the probability of finding an angle between the F0–F1 and the F2–F3 pairs at three different regions away from the bilayer phosphate atoms. C, D. Normalized number of contacts between the talin and lipids mapped onto the final snapshot (C) of the tal-h2F0-CG simulations. Contacts are defined by using a distance cut-off of 7 Å between the protein residues and the lipids. Blue indicates a low number (i.e zero contacts) white indicates a medium number (i.e. 7500 contacts) and red a large number of contacts (i.e. 15000 contacts). The bilayer headgroups are shown as grey spheres and the lipid tails as green spheres. The sidechains of the key basic residues (i.e. ARG and LYS), which are in contact with the lipids, are also shown. The residues that made more than 90% of the contacts during the tal-h2F0-AT simulations are shown in Table S3.

