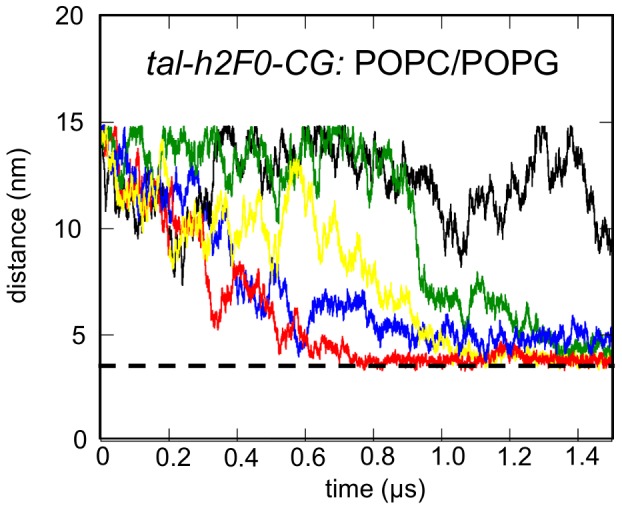
Figure 5. Simulation of the association of talin with a lipid bilayer (tal-h2F0-CG; see Table 1).

Distance between the centers of mass of talin and a lipid bilayer as a function of time for the simulation tal-h2F0-CG with an anionic (POPC/POPG) lipid bilayer. The different colored lines correspond to the five repeat simulations. The horizontal broken line indicates the distance observed when talin is associated with the bilayer surface.
