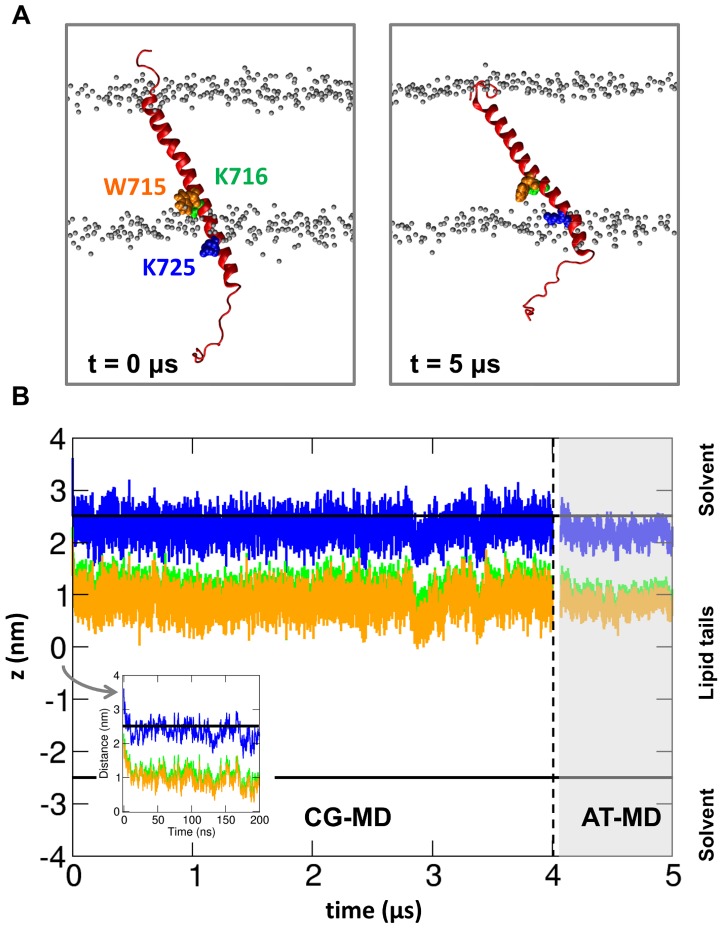
Figure 8. The β-TM helix during simulation of a talin/integrin TM complex with a lipid bilayer (αβ-talh2-CG and αβ-tal2ho-AT simulations; seeTable 1).
A. Position of the β-TM helix at the beginning (t = 0 µs) and at the end (t = 5 µs) of the simulations. Residues W715, K716 and K725 are shown in orange, green and blue respectively. The talin head domain and the α integrin subunit are omitted for clarity, and the lipid bilayer is indicated via the phosphates. B. Positions along the bilayer normal (z) during the two simulations of residues W715, K716 and K725 (using the same color code as in A). The horizontal black lines indicate the positions of the phosphates. The inset shows the first 200 ns of the CG simulation. Note that the starting structure for the AT-MD simulations (indicated by a break in the data traces and the vertical broken line) was obtained by merging the trajectories from all five simulations of the αβ-talh2-CG simulation ensemble and clustering the TM region of the talin/αβ complex as described in our previous study (see [34]).

