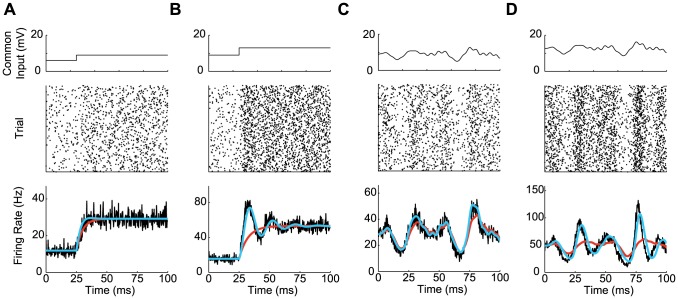
Figure 1. Firing-rate response of an uncoupled spiking population.
A. Response to step in the common input current in the noise-dominated regime. B. Response to step in the common input in the mean-dominated regime. C. Response to randomly fluctuating common input in the mean-dominated regime. D. Response to randomly fluctuating common input in the mean-dominated regime. In A–D, top panel shows common injected current; middle panel shows spike raster for 500 trials with an EIF neuron; bottom panel shows firing rate response of 10,000 EIF neurons (black), the classic rate model (red), and the complex-valued rate model (blue). Background noise is constant, with A & C  mV, B & D
  mV.
mV.

