Figure 2.
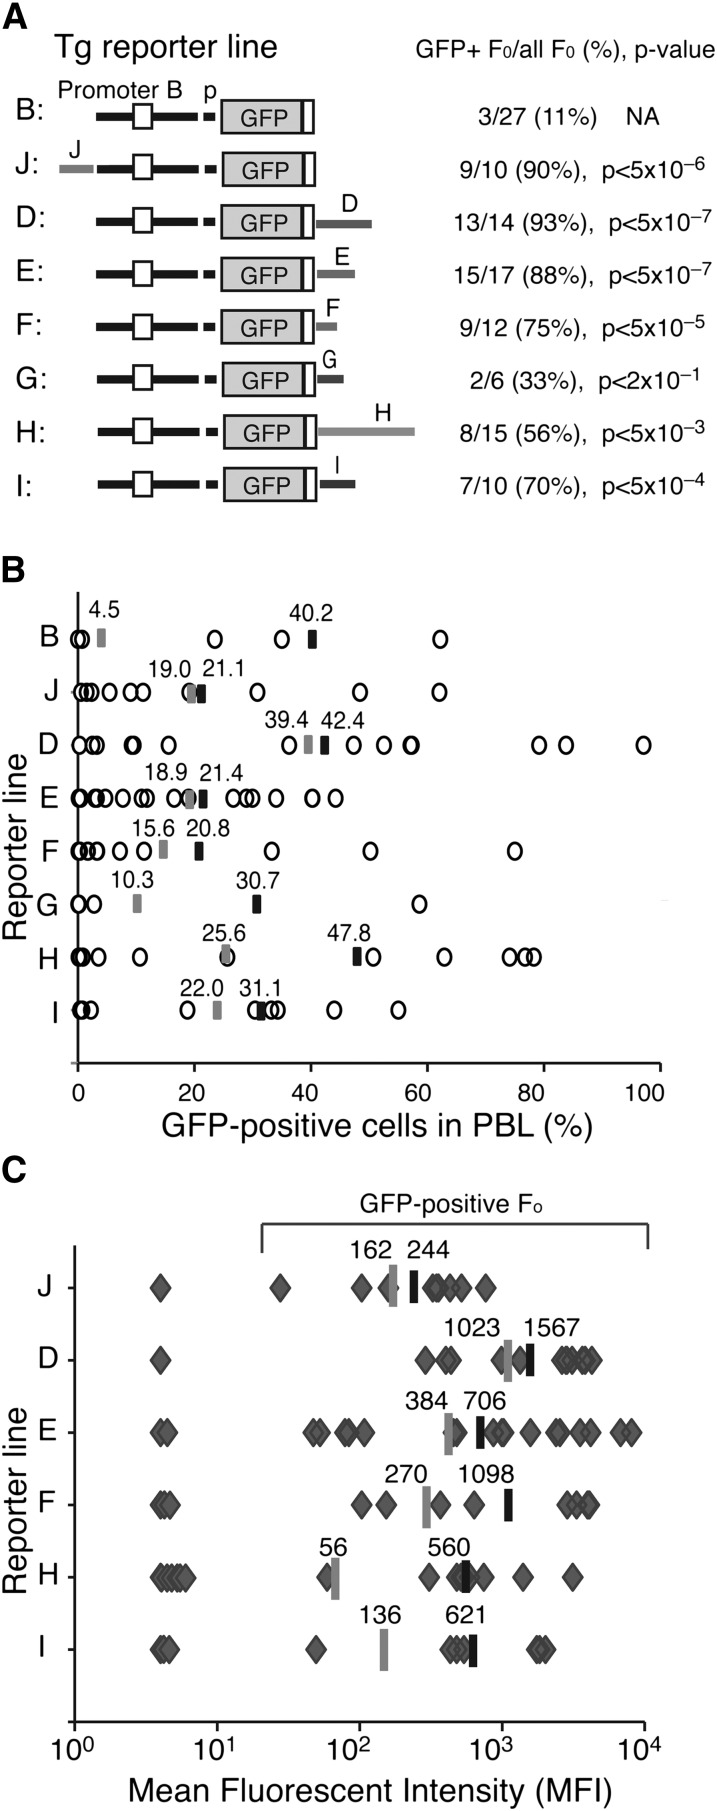
Enhancer activities associated with the Ikzf1 regulatory sites. (A) Diagrams of the reporter constructs used in this study are shown on the left. The number of GFP-expressing founders is displayed over the total number of founders obtained for each reporter. The statistical significance of the difference (increase) in GFP-expressing founder lines compared with the parental B-p-GFP lines was provided by χ2 analysis and is shown as a P value. (B) The percentage of GFP+ PBLs assessed by flow cytometry is depicted for each founder line as circles. The average percentage of GFP+ PBLs for each transgenic reporter was calculated for either all GFP-expressing founders (black bar) or all founders (gray bar). (C) The MFI of GFP+ PBLs was estimated for each founder line (gray diamonds) of every transgenic reporter as described in panel B.

