Figure 2.
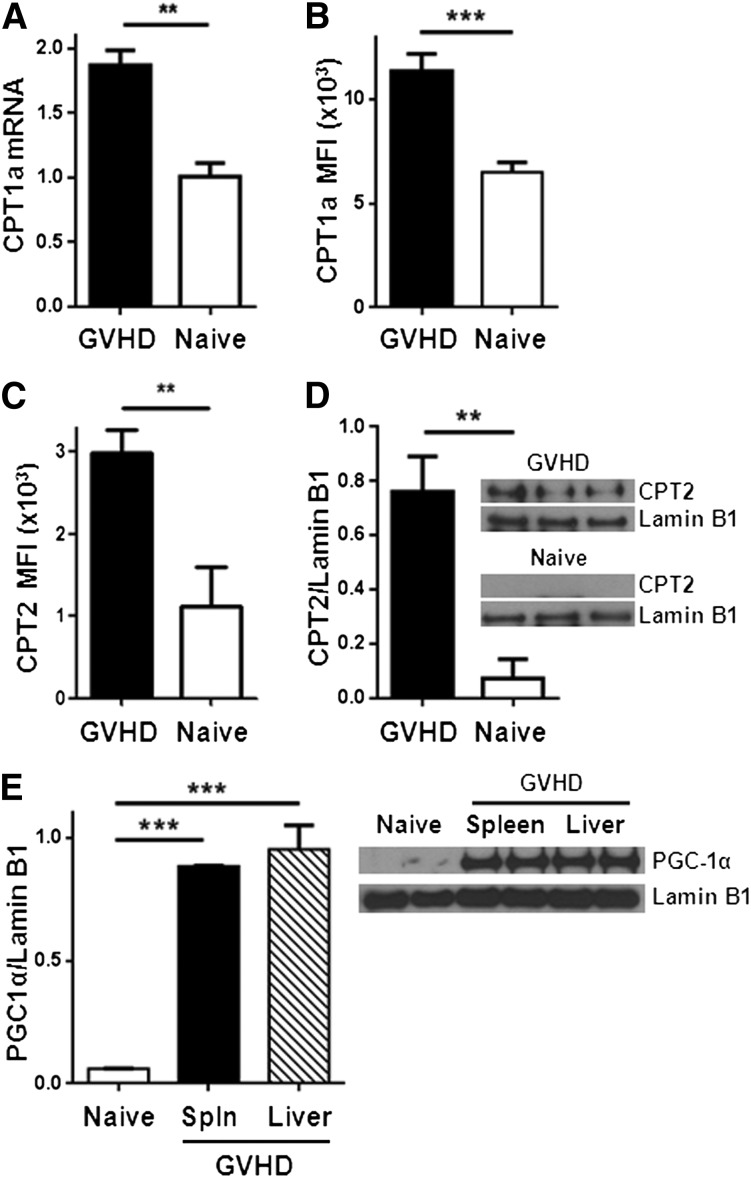
Allogeneic T cells up-regulate CPT1a, CPT2, and PGC1-α during GVHD. (A) Donor T cells were flow-sorted from either naïve donor animals or allogeneic recipients 7 days after BMT (GVHD) and levels of CPT1a quantitated by RT-PCR. (B) Median fluorescence intensity (MFI) of CPT1a in T cells following intracellular staining as described in Methods. Data represent 4 to 6 mice/group. (C) Intracellular CPT2 was measured by flow cytometry (supplemental Figure 4) and the results quantitated (n = 4/group). (D) Donor T cells (CD45.1+, TCR-β+, Annexin−) were flow-sorted and cell lysates probed for CPT2 by western blot. Shown is 1 of 3 independent experiments. (E) T-cell lysates from spleen or liver were purified by flow-sorting and probed by western blot for levels of PGC1-α. Each lysate was pooled from ≥3 mice. **P < .006, ***P < .0001.

