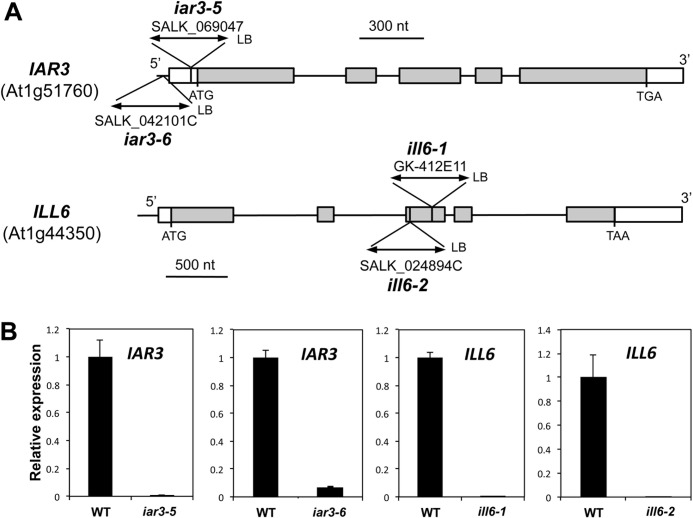
FIGURE 5.
Molecular characterization of iar3 and ill6 insertion alleles. A, positions of T-DNA insertions in the different mutant lines are shown, and for each allele the position of the left border (LB) is indicated. Boxes denote exons and thin vertical lines denote introns or promoter regions. White boxes depict untranslated regions and gray boxes coding regions. B, RT-qPCR analysis of gene expression in WT and mutant leaves. Leaves were harvested 1 h after wounding and abundance of transcript regions spanning the insertion site was monitored. Expression in mutant lines was calculated relative to WT levels set to 1. Expression was normalized using two reference genes.

