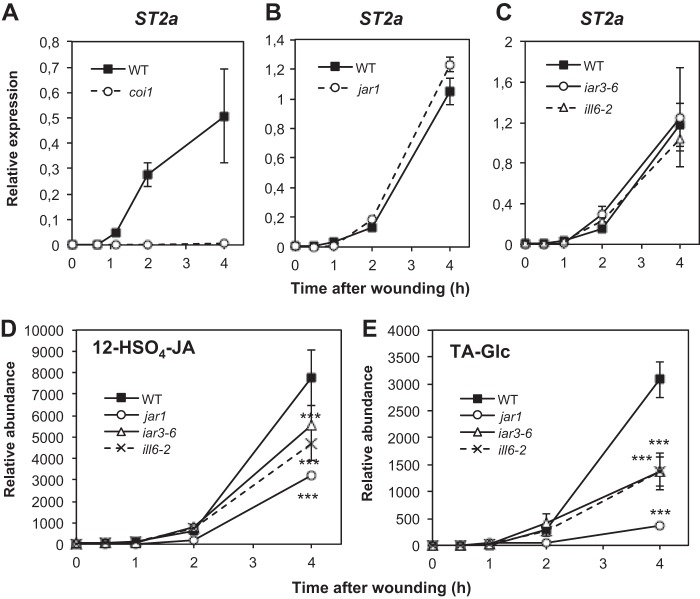
FIGURE 7.
Analysis of tuberonic acid metabolization pathways in jar1, coi1, and amidohydrolase mutants upon wounding. Leaves were harvested at increasing times after wounding and submitted to RNA extraction. Expression of ST2a was examined by real-time PCR in coi1 (A), jar1 (B), and iar3-6 and ill6-2 (C) mutants relative to WT and represented as ΔΔCt values. Two reference genes were used for normalization. The TA derivatives 12-HSO4-JA (D) and tuberonic acid glucoside (TA-Glc, E) levels were determined in WT, jar1, iar3-6, and ill6-2 plants. Triplicate determinations ± S.E. are shown for all analyses. Asterisks indicate significant differences between mutant and WT at p < 0.001 (two-way ANOVA).

