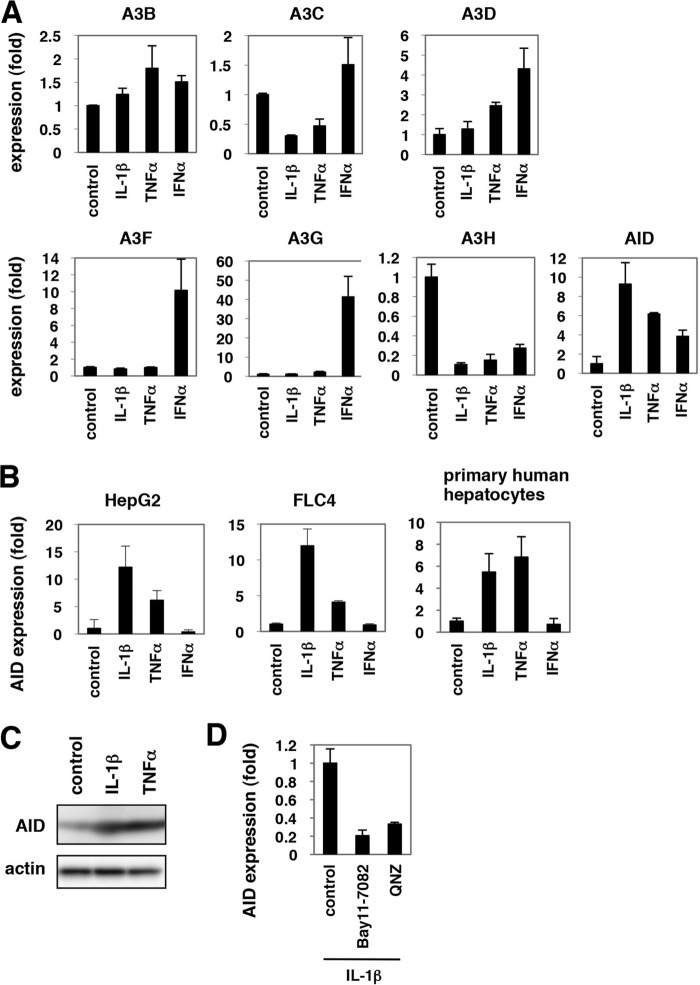
FIGURE 4.
AID expression was induced by IL-1β and TNFα. A, mRNAs for A3B, -C, -D, -F, -G, -H and AID were quantified by real time RT-PCR analysis in HepaRG cells treated with 100 ng/ml IL-1β, 100 ng/ml TNFα, or 100 IU/ml IFNα for 12 h or left untreated. Graphs show the relative expression levels compared with the controls set at 1. B, AID mRNA was detected in HepG2, FLC4 cells, and PHH treated with IL-1β, TNFα, or IFNα or left untreated. Induction of AID by IL-1β and TNFα was observed in HepG2 and FLC4 cells and primary human hepatocytes. C, AID protein (upper panel) and actin levels as an internal control (lower panel) were examined by immunoblot of primary human hepatocytes treated with IL-1β or TNFα or left untreated. D, AID mRNA was detected in PHH treated with 100 ng/ml IL-1β in the presence or absence of NF-κB inhibitors, Bay11-7082, or QNZ for 12 h.

