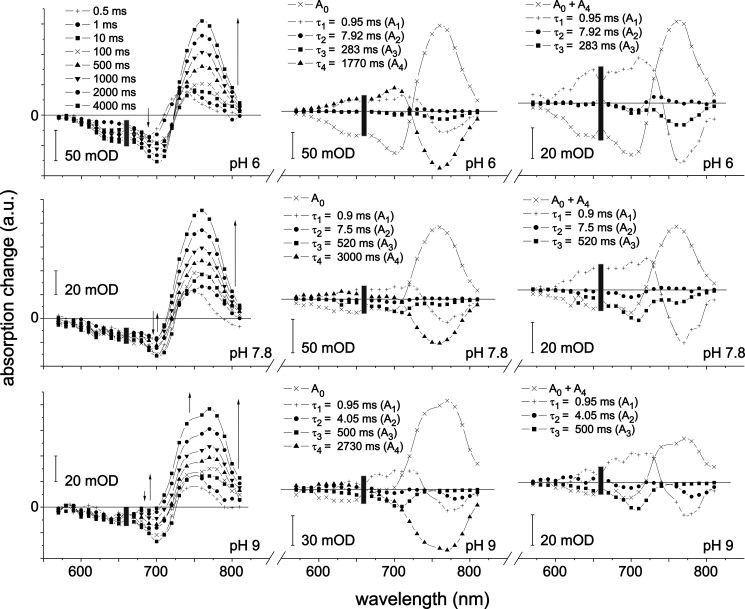
FIGURE 4.
Flash photolysis measurements of the Pr to Pfr photoconversion of Agp2. Left, transient absorption difference spectra of pre-illuminated phytochrome (785 nm) after flash irradiation of Pr (660 nm) at pH 6, 7.8, and 9 at selected times as indicated. Middle, related decay-associated spectra Ai. Right, same as middle but sum of A0 and A4 instead of A0. The thin arrows indicate the time course of signal amplitude. The gray rectangle marks the region of pump pulse artifacts. a.u., absorbance units; mOD, milli-OD units.

