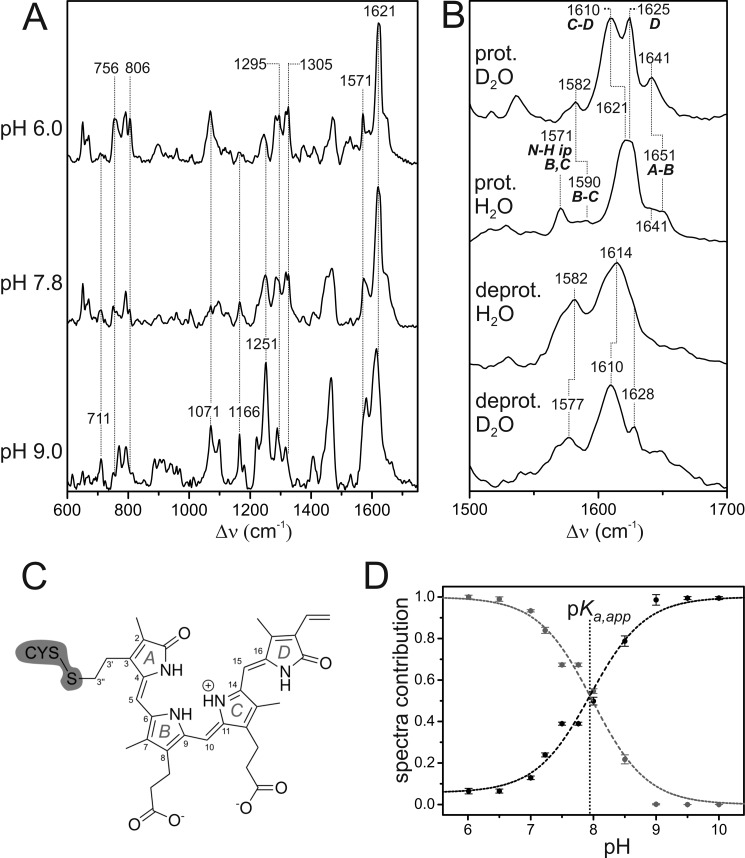
FIGURE 5.
A, RR spectra of the Pr state of Agp2 at different pH values measured with 1064-nm excitation at 80 K. Residual spectral contributions of the Pfr state and the apoprotein were subtracted. The spectrum at pH 9.0 represents the pure “alkaline” form with a deprotonated chromophore. Minor spectral contributions of this deprotonated species were subtracted from the top spectrum such that it shows only the “acid” form including a protonated chromophore. B, RR spectra of the pure spectra of the protonated (prot.) and deprotonated (deprot.) species in H2O and D2O showing the C=C stretching region. The ring notation of the individual rings is present in C. C, structural formula of the chromophore in the ZZZssa configuration. D, relative contributions of the component spectra of the protonated (gray) and deprotonated species (black) of the Pr state of Agp2 as a function of the pH as determined from the RR spectra by component analysis. Error bars refer to three series of measurements of different samples. The dashed lines represent the fit of the Henderson-Hasselbalch equation (Equation 7) to the data. The vertical dotted line indicates the pKa,app value (7.9), which affords a pKa of 7.6 according to Equation 8.

