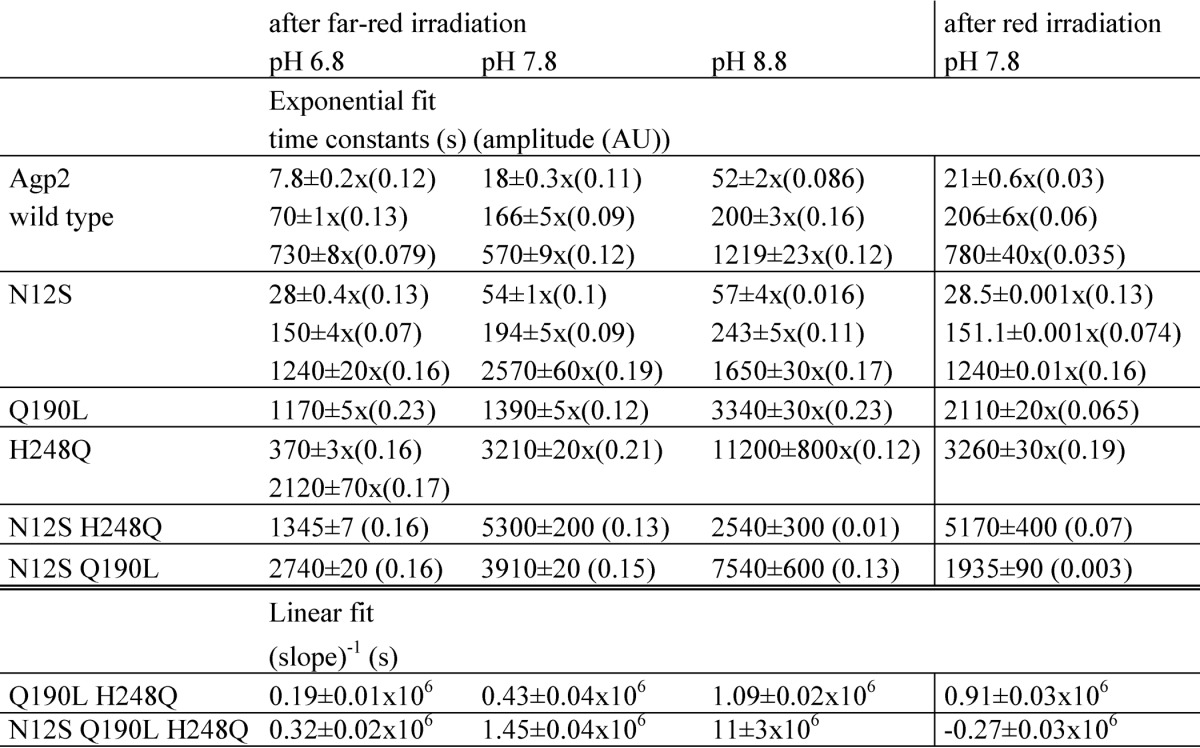
TABLE 1.
Time constants of dark conversion
Absorbance was measured continuously at 750 nm (Pfr maximum) for 4000 s after far-red (780 nm) or red (655 nm) irradiation to achieve high initial Pr and Pfr levels, respectively. Far-red pre-irradiation was combined with three different pH values as given above the columns; dark conversion after red pre-irradiation was measured at pH 7.8 only. Exponential decay functions with one, two, or three components were fitted to the data (Origin 8.5). Amplitudes of the fit functions are given in parentheses. The Q190L/H248Q double mutant and the triple mutant could not be fitted with exponential functions. In those cases, linear functions were used to simulate the data. For comparison with the time constants of the exponential fits, the reciprocal slopes are given. Phytochrome concentrations were comparable with those in Fig. 7. AU, absorbance units.

