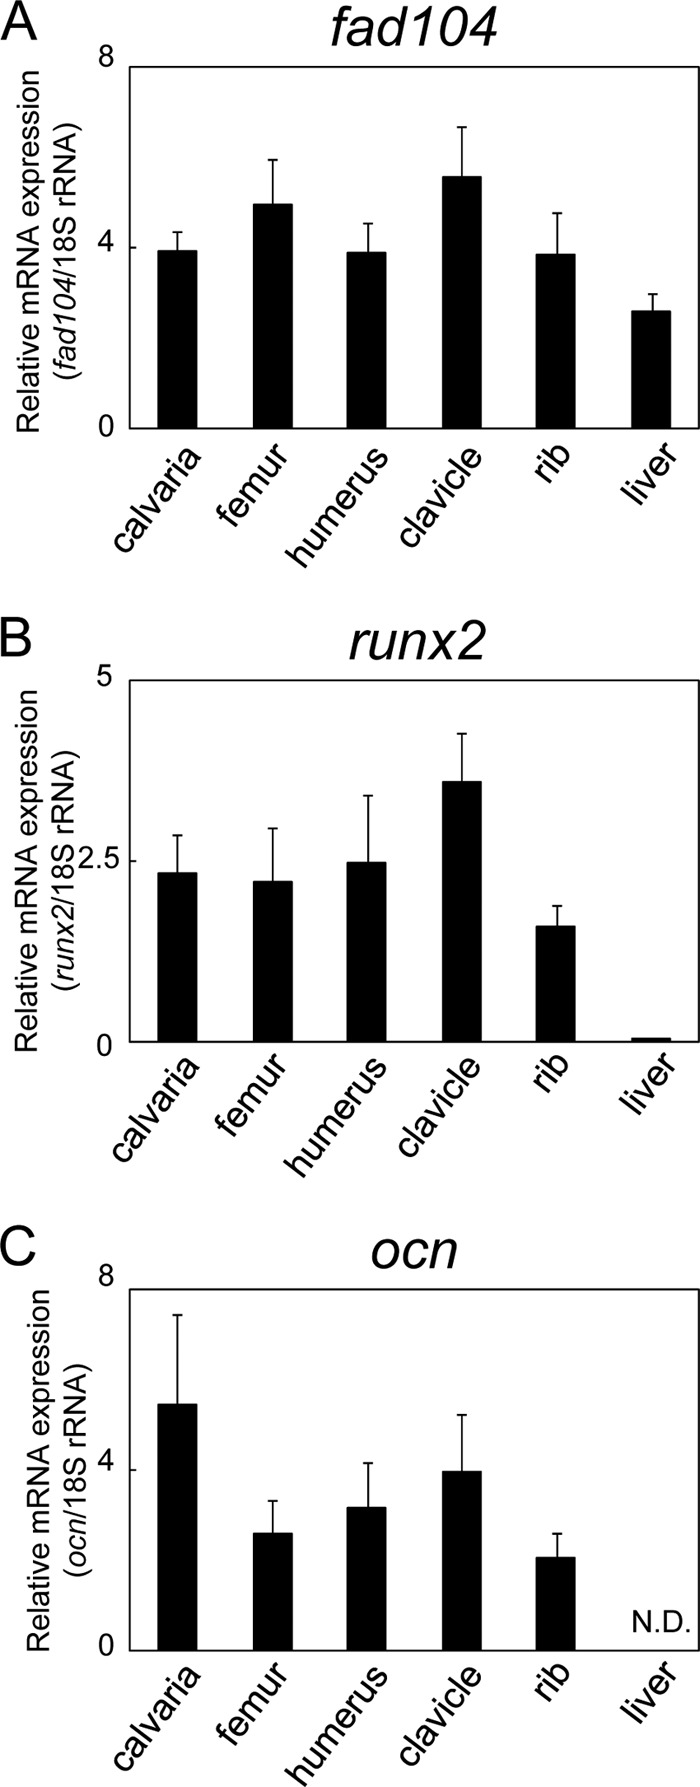
FIGURE 2.

The expression level of fad104, runx2, and ocn in various bone tissues and liver. The expression levels of fad104 (A), runx2 (B), and ocn (C) mRNA in calvaria, femur, humerus, clavicle, ribs, and liver at E18.5 were determined by qRT-PCR and normalized with 18 S rRNA expression. The data represent means with S.E. (error bars) (n = 5).
