FIGURE 1.
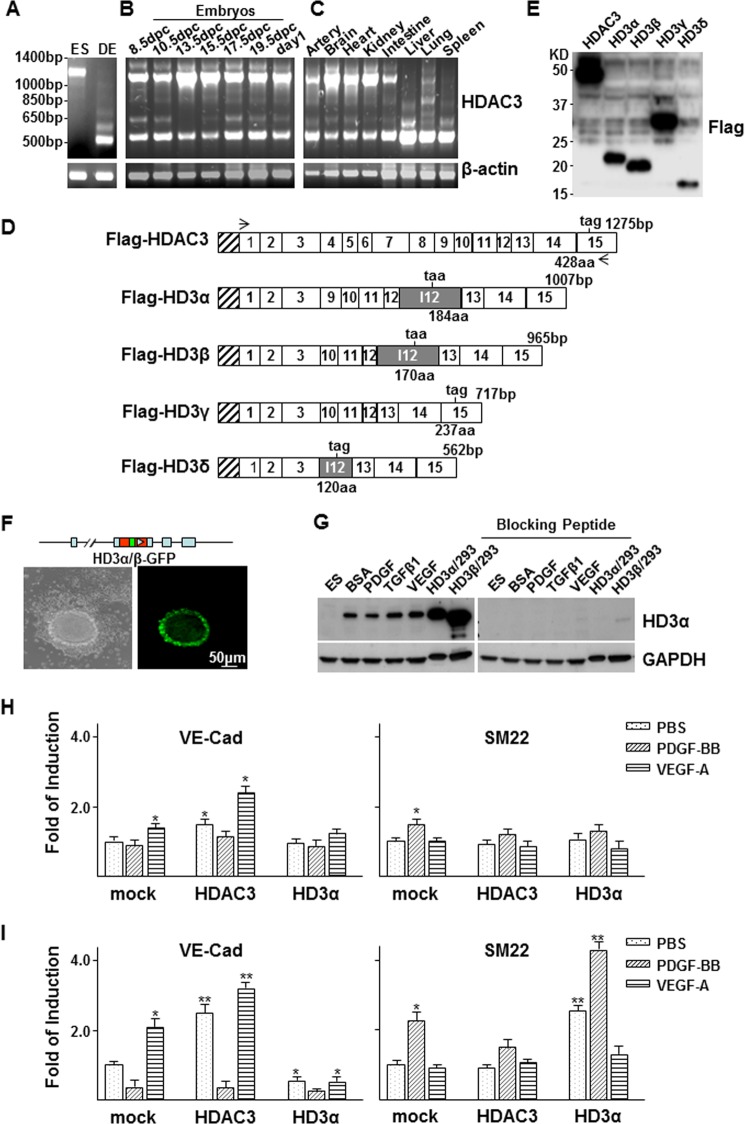
HDAC3 undergoes unconventional splicing. A–C, multiple bands of HDAC3 were detected in DES cells (A), mouse embryos (B), and adult tissues (C). Undifferentiated ES cells (ES) were included as control cells, and β-actin was included as a loading control. D, schematic illustration of the sequence structure of cloned HDAC3 and splicing variants. Open boxes, exons with numbers inside; shadowed box, intron 12. The length of each isoform is indicated at the DNA base (bp) and amino acid (aa) levels. The taa or tag is the stop codon. The stretched box indicates the FLAG tag. Arrows, primer positions. E, Western blot shows the protein bands for HDAC3 and the splicing isoforms in transfected 293 cells. F and G, HDAC3 splicing occurred naturally during stem cell differentiation as revealed by GFP observation (F) and Western blot (G). F, HD3α/β-GFP knock-in (top schematic illustration) ES cells were cultured in a collagen I-coated flask in differentiation medium for 3 days, followed by imaging at inverted phase (left) and fluorescence (right) microscopes. G, ES cells were cultured in a collagen I-coated flask in differentiation medium for 2 days, followed by treatment with 10 ng/ml rat PDGF-BB, 5 ng/ml TGFβ1, or 5 ng/ml VEGF. Western blot analysis was performed with anti-HD3α antibody pretreated with (right) or without (left) blocking peptide. Cell lysates from 293 cells transfected with pShuttle2-FLAG-HD3α (HD3α/293) and pShuttle2-FLAG-HD3β (HD3β/293) were included as positive control. H and I, quantitative RT-PCR analysis of the effect of overexpression of HD3α on VE-Cad and SM22 expression in ES (E) and ES-derived EC (F) differentiation. *, p < 0.05; **, p < 0.01. Data presented are representative of or the average of three independent experiments.

