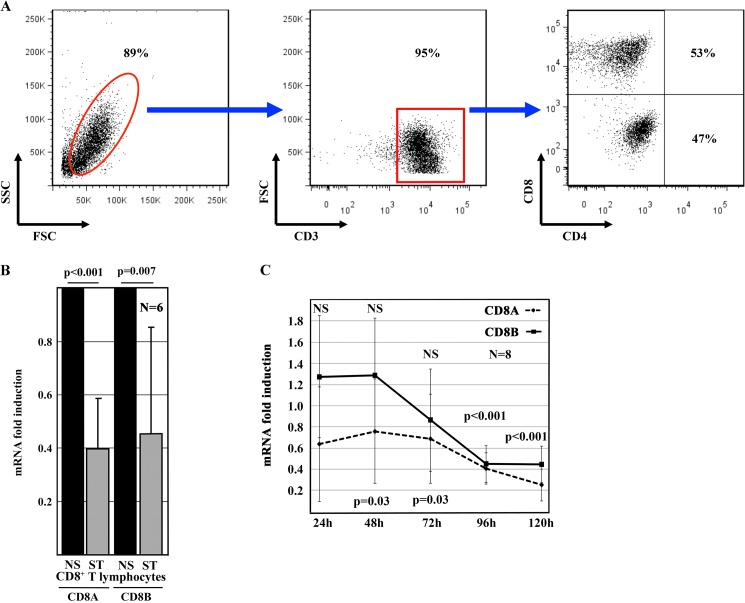
FIGURE 1.
Human CD8 protein and mRNA expression in response to TCR stimulation. A, primary human CD8+ T lymphocytes from healthy individuals were stimulated with plate-bound anti-CD3 and anti-CD28 antibodies for 120 h. Most stimulated CD8 T cells were alive as shown by their forward (FSC) and side (SSC) scatter distribution (left panel) and expressed CD3 (middle panel). A large proportion of CD8+ T lymphocytes down-regulated CD8 and transformed into DN T cells (right panel). B, TCR stimulation with anti-CD3 and anti-CD28 antibodies for 120 h significantly decreased CD8A and CD8B mRNA expression in primary human CD8+ T lymphocytes from healthy individuals. Values are means ± S.D. NS, non-stimulated T cells; ST, TCR-stimulated T cells. C, kinetics of CD8A and CD8B mRNA expression in response to TCR stimulation with anti-CD3 and anti-CD28 antibodies over 120 h in primary human CD8+ T lymphocytes from healthy individuals. Values indicate -fold changes over the relative gene expression in unstimulated T cells, which were assigned a relative expression of 1. NS indicates time points at which TCR stimulation did not result in significant changes. p values indicate statistically significant changes in gene expression after 48 and 72 h (CD8A) or 96 and 120 h (CD8A and CD8B).

