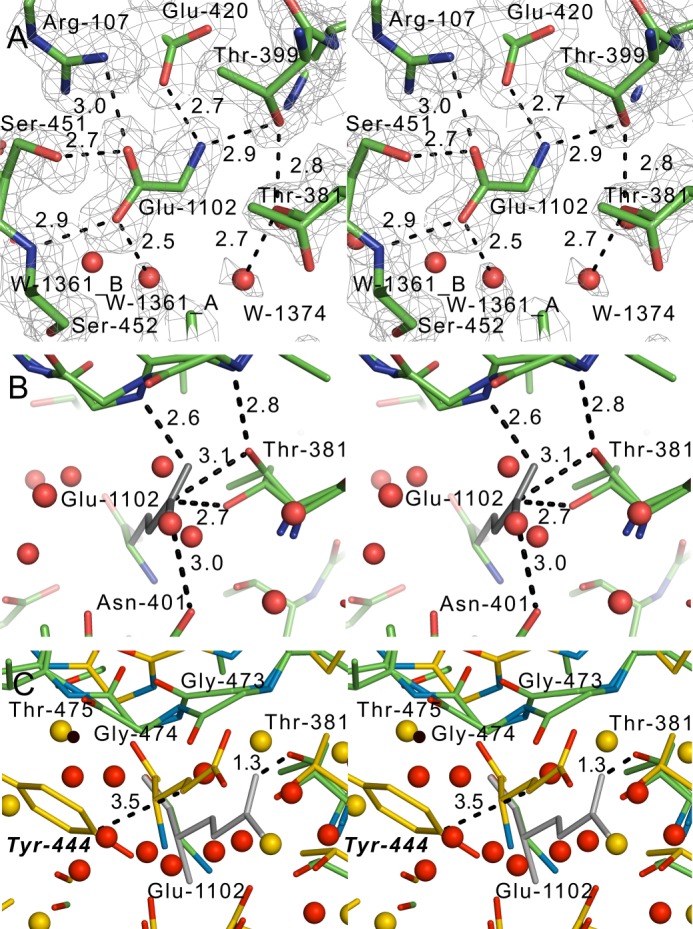
FIGURE 6.

Stereo views of the active site. A, a 2mFo − DFc simulated annealing omit map contoured at the 1 σ level, where Glu-1102 was omitted. Dashed lines, hydrogen bonds; red spheres, water molecules. B, modeled side chain of Glu-1102 (colored gray). C, stereo view of the crystal structure of EcGGT (2DBX; yellow carbon atoms) superposed on hGGT1 (green carbon atoms). The yellow-colored glutamate is from EcGGT. The gray sticks represent the modeled side chain atoms of the glutamate in the structure of hGGT1. The residue numbers in boldface italic type are for EcGGT. The dashed lines represent interatomic distances, not hydrogen bonds. The yellow spheres are water molecules in the EcGGT structure.
