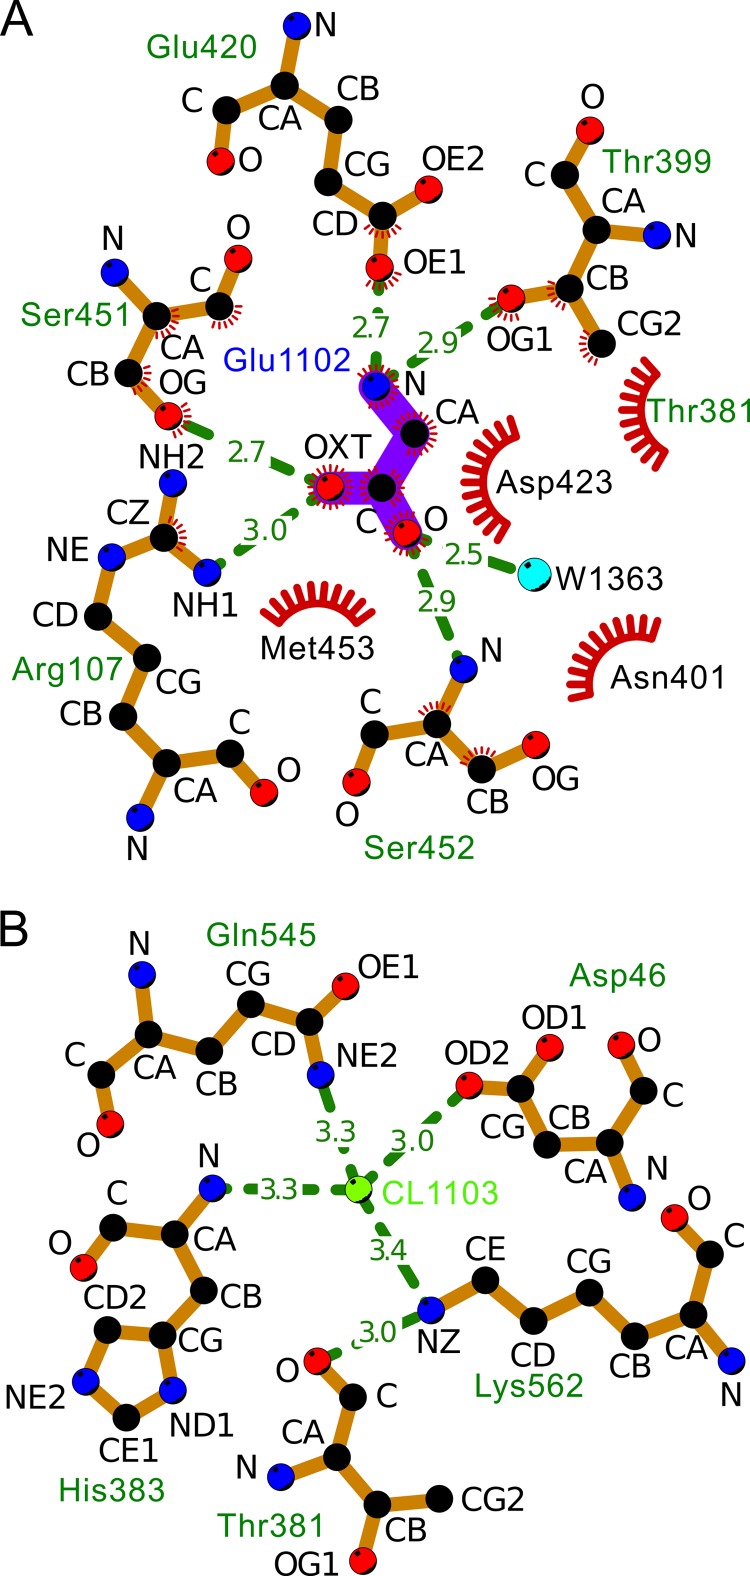
FIGURE 8.

LIGPLOT diagrams. A, interactions between the backbone of hGGT1 and the α-nitrogen and α-carboxylate groups of glutamate (Glu-1102) in the substrate binding site of the enzyme (bond lengths not to scale); B, interactions between CL-1103 and the surrounding atoms, including the backbone of Thr-381. The ligand bonds are colored purple. The crescents with the bristles represent hydrophobic interactions. The hydrophobic atoms are colored black and are labeled with black letters. The polar atoms are in red (oxygen) or blue (nitrogen). The dashed lines represent hydrogen bonds.
