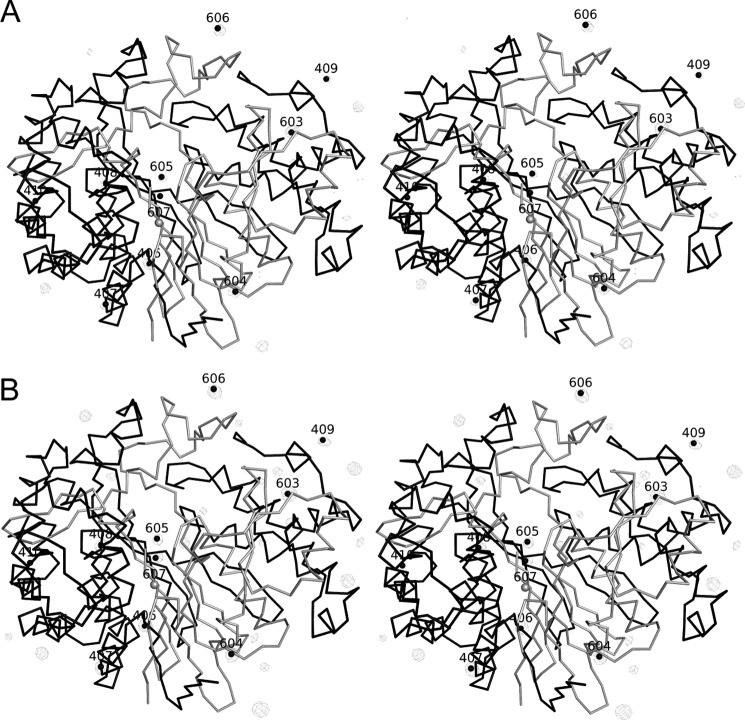
FIGURE 9.
Difference electron density maps with peaks corresponding to anion sites. Shown are a Bijvoet difference map showing the sites of the bound iodides in the crystal structure of hGGT1-iodide (PDB code 4GG2) (A) and an hGGT1-iodide minus hGGT1-Glu (PDB code 4DGX) isomorphorous difference map (B). The large subunit is represented by a C-α trace that is colored black. The small subunit is represented by a C-α trace that is colored white. B, the iodide sites were >15 σ in height in the (Foiodide − Fonative) exp(−iαnative) isomorphous difference map. In comparison, the difference peaks due to non-isomorphism between the protein structures were less than 5 σ. This second difference map provided independent evidence of the presence of the iodides. Only one (residue 606) of the eight iodides were assigned as additional chlorides (giving a total of two chlorides) in the crystal structure of hGGT1-Glu (PDB code 4GDX). The other iodide binding sites are probably not well occupied by chlorides because the chlorides were too small to interact as well with the protein.

