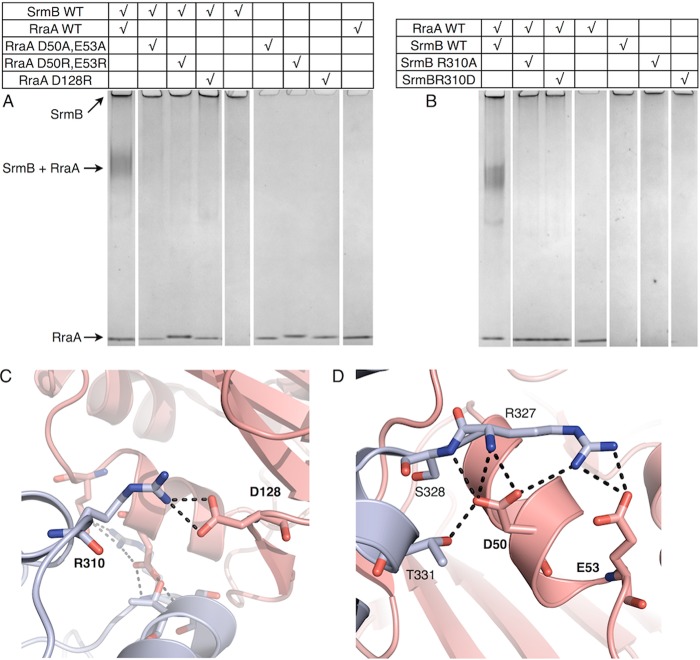
FIGURE 3.
Analysis of molecular interactions between RraA and SrmB. A and B, interactions of WT and mutated proteins evaluated by electrophoretic mobility shift assays. Final SrmB and RraA concentrations were 2.5 and 7.5 μm, respectively. Panels C and D highlight residues mutated for these analyses. SrmB is light blue and RraA is colored salmon. For clarity, side chains of residues that do not interact directly with mutated residues are not shown.

