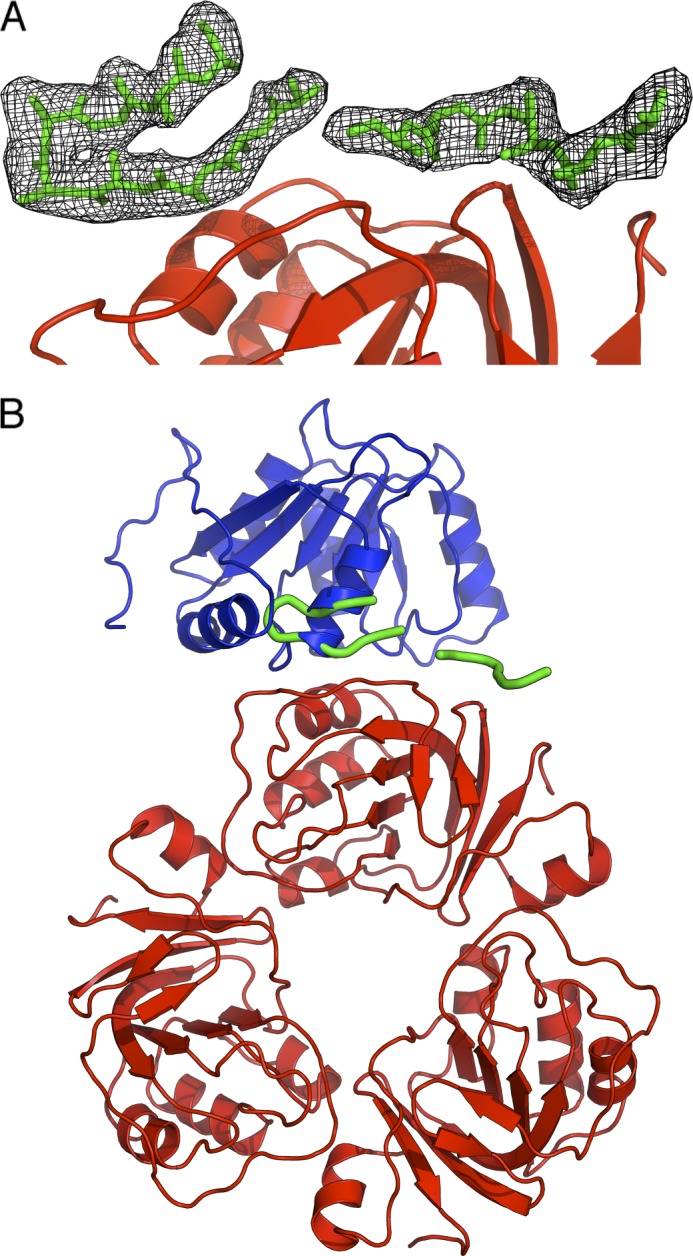
FIGURE 4.

Crystal structure of RraA in complex with the C-terminal extension of RhlB (RhlB(398–421)). A, the RhlB fragment is shown in sticks representation (green). The black mesh represents a 2Fo − Fc electron density map. RraA is colored red. B, superposition of SrmB CTD (blue) bound to RraA on the RhlB fragment. The RraA trimer is shown in red, and RhlB(398–421) is shown in green.
