
FIGURE 2.
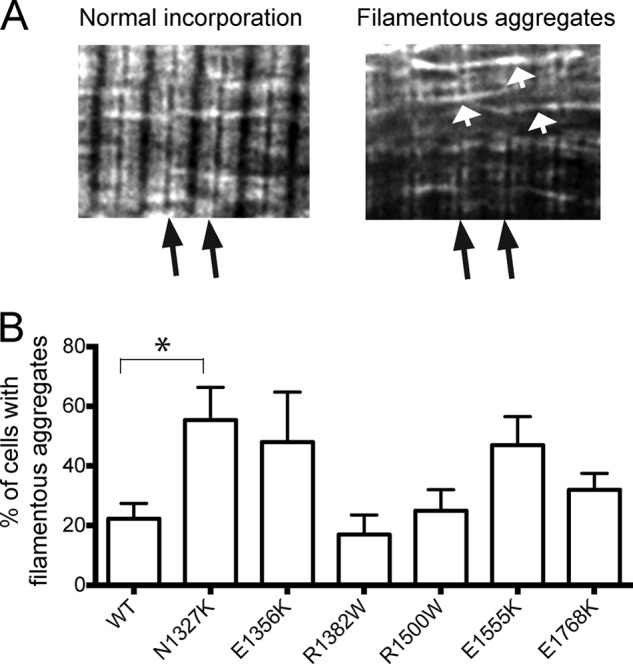
Analysis of eGFP-MHC incorporation in adult cardiomyocytes. A, representative images showing normal incorporation contrasted with poor incorporation with filamentous aggregates. Black arrows show the positions of Z-disks. White arrows show filamentous aggregates. The images shown are for the N1327K mutant. B, quantification of eGFP incorporation for WT and each of the mutants. The results shown are the mean values (± S.E.) for 3–6 experiments. The % of cells with aggregates was significantly higher in N1327K-expressing cells compared with WT cells (p < 0.05) (indicated by the asterisk).