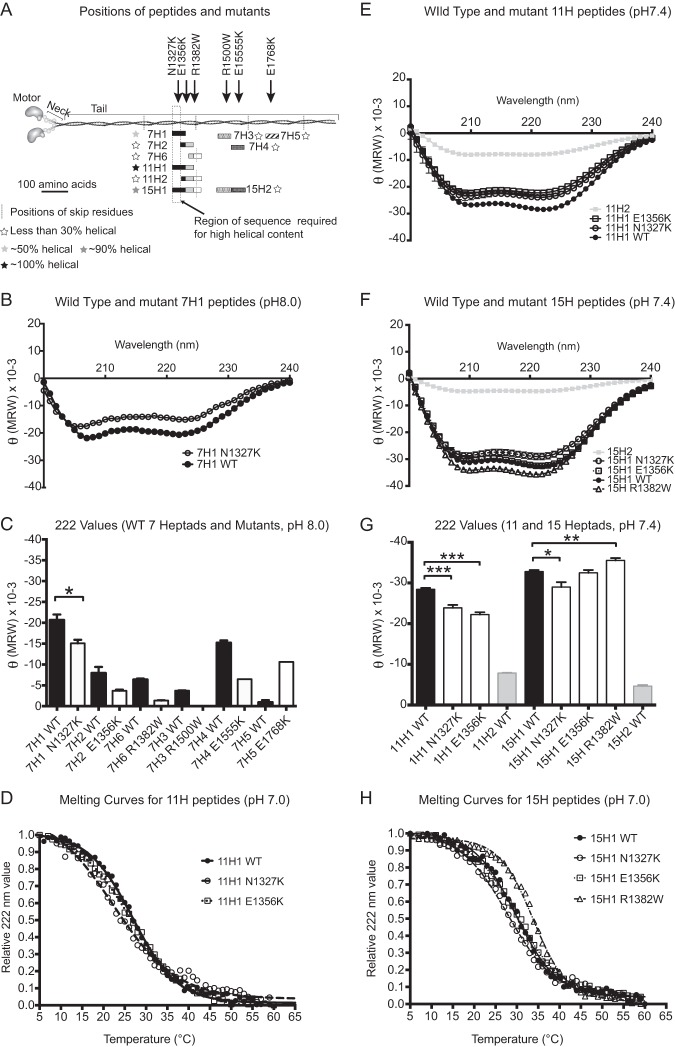
FIGURE 5.
Properties of wild type and mutant peptides. A, diagram of the positions of the tail peptides and mutants investigated in the tail. The black line represents a scale bar of 100 amino acids alongside the coiled-coil tail of the myosin. The positions of the four skip residues are shown by gray dotted lines. The shaded rectangles show the positions, with respect to their positions in the tail of myosin, of each of the peptides investigated, in which overlapping sequence in different peptides is shown in the same color/pattern. For example, heptad H1 is shown in black, and the start of heptad 7H2 is shown as black, as it contains the C-terminal sequence of heptad 7H1. The filled stars denote the relative α-helical content of each peptide (see key). The vertical rectangle shown using a dashed line shows the region of the sequence required for high α-helical content. B, CD spectra for the 7H1 WT and mutant (N1327K) peptides (pH 8.0, 150 mm NaCl, 10 mm phosphate buffer). C, summary plot of the values for θ222 (MRW) (which reports on α-helical content) measured for each of the WT 7H peptides (shown as black bars) and the corresponding mutant (shown as white bars). Conditions used were pH 8.0, 150 mm NaCl, 10 mm phosphate buffer. The mean together with the standard error is shown. The decrease in helical content for N1327K is significant (p < 0.05). D, normalized thermal melt curves for 11H peptides (pH 7.0, 50 mm NaCl, 10 mm phosphate buffer). E, CD spectra for the WT and mutant 11H1 peptides (pH 7.4, 50 mm NaCl, 10 mm phosphate buffer). F, CD spectra for the WT and mutant 15H1 peptides (pH 7.4, 50 mm NaCl, 10 mm phosphate buffer). G, summary plot of the θ222 (MRW) values for the WT 11H1 (black bars) and 15H1 (black bars) and mutant 11H1 and 15H1 peptides (white bars) as shown in E and F, together with the value for the WT 11H2 and 15H2 peptides (gray bars). Significant changes in helical content between WT and mutant peptides are indicated as follows: *, p < 0.05; **, p < 0.01, and ***, p < 0.001. H, normalized thermal melt curves for 15H peptides (pH 7.0, 50 mm NaCl, 10 mm phosphate buffer). MRW, mean residue weight.

