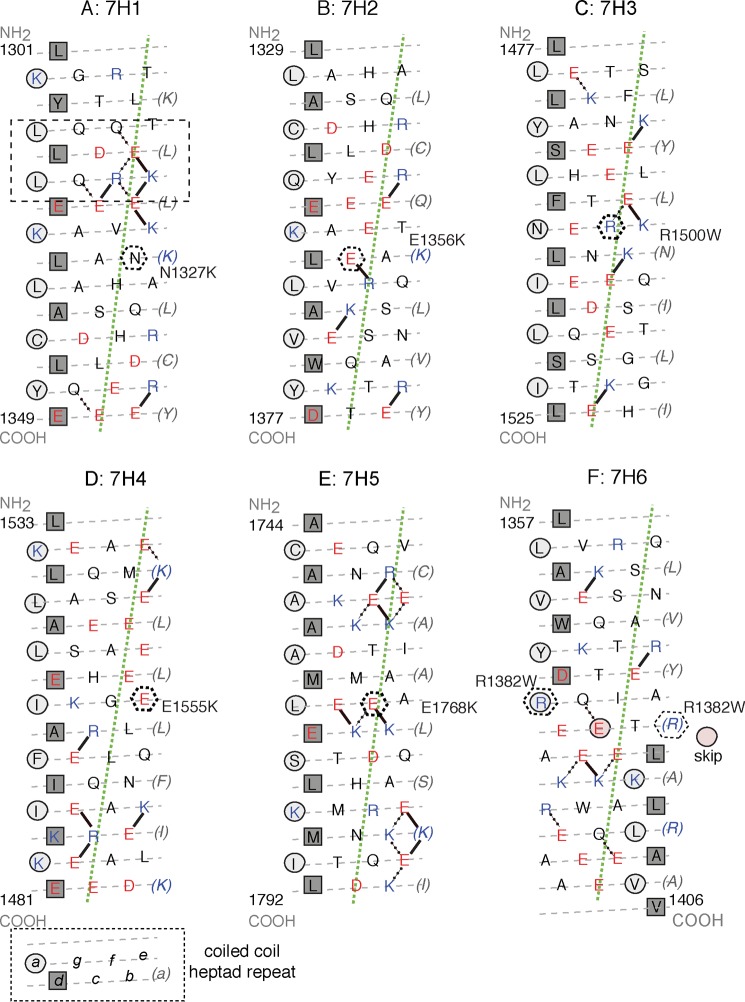
FIGURE 6.
Heptad net plots of each of the WT 7H peptides tested. A–F shows peptides 7H1 to 7H6. In each plot, the preferred intra-chain ionic interactions (31, 37) are shown as solid lines. In addition, alternative/other interactions are shown as dotted lines. Every seventh residue is repeated on the right of the plot (in brackets) so that all interactions can be shown. The gray dashed lines indicate the path of the polypeptide backbone; the green dotted line defines the orientation of the α-helix axis. The light gray circles indicate a-positions and the squares indicate d-positions that form the hydrophobic seam. A, boxed region (dashed lines) within this 7H1 peptide that favors coiled coil formation is shown. The black hexagons (dashed lines) indicate the positions of the mutant residues within each sequence.

