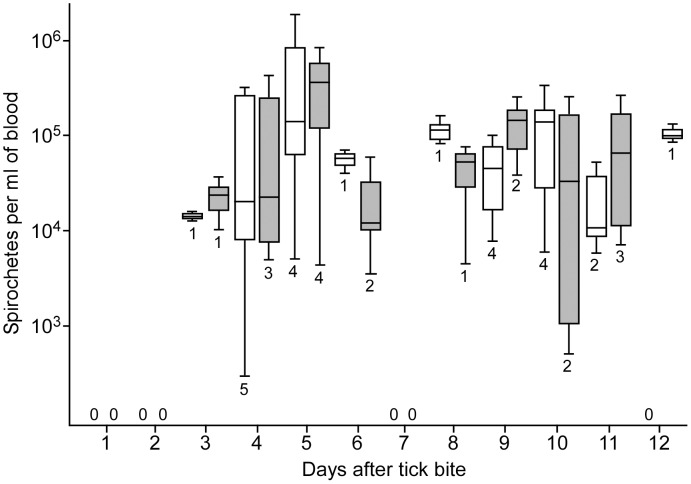
Figure 8. Spirochete densities within murine blood after feeding ticks infected with ΔbrpA mutants or wild type spirochetes.
The white (mutant infected mice) and grey (wild type infected mice) shaded box and whisker plots represent the lower and upper quartiles, median, and lower and upper extremes of spirochete densities on a given day. The number below each plot and the zero values above the x-axis represents the number of animals infected with mutant or wild type spirochetes on the given day.

