Figure 2.
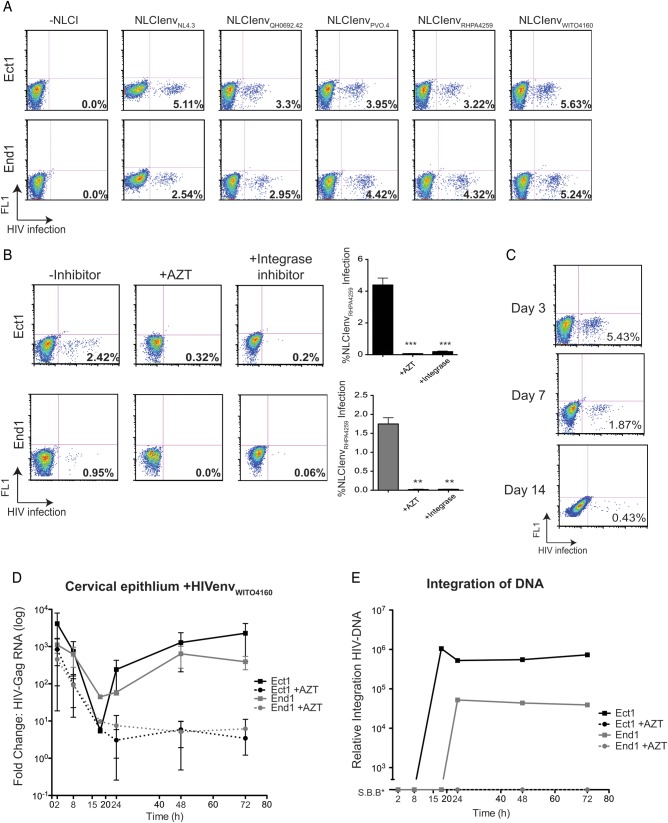
Cell-free human immunodeficiency virus type 1 (HIV-1) infection of cervical epithelial cells. Ect1 and End1 (approximately 150 000 cells/well, 24-well plate) were examined for infection 72 hours after exposure to recombinant fluorescent protein-expressing HIV NL-CIenv (30 ng/mL). Cells were incubated with virus for 2 hours in Dulbecco's modified Eagle's medium. Cells were washed vigorously with phosphate-buffered saline prior to trypsinization for 10 minutes at 37°C or until adherent cells were visibly removed from the well. Cells were then replated and allowed to grow in culture for an additional 72 hours (A–C, flow cytometry) or for the indicated time (D and E, quantitative real-time polymerase chain reaction [qRTPCR]). A, Ect1 (top) and End1 (bottom) cells were infected with cell-free NL-GIenvNL4.3 (X4-tropic) or NL-CIenvQH0692.42, NL-CIenvPVO.4, NL-CIenvRHPA4259, NL-CIenvWITO4160 (R5-tropic) viruses and examined 72 hours post infection via flow cytometry. FL1 denotes empty fluorescent channel. B, Ect1 and End1 NL-CIenvRHPA4259 infection was inhibited by both reverse transcription inhibitor, AZT (50 µM), and integrase inhibitor (50 µM). Cells were preincubated for 15 minutes with either inhibitor prior to NL-CIenvRHPA4259 incubation, and inhibitors were maintained after cells were replated. Graph shows the mean and standard deviations of 4 independent experiments; inhibition of infection was significant using a 2-tailed, unpaired t-test comparing infected cells to inhibitor-treated cells (Ect1-AZT, P = .0005; Ect1-integrase, P = .0013; End1-AZT, P = .007; End1-integrase, P = .009). C, NL-CIenvWITO4160 infection of Ect1 cells persists for up to 14 days following initial infection. Cells were passaged as necessary to avoid overconfluency. D, Kinetics of viral Gag-encoding RNA measured by qRTPCR following exposure to HIV. Ect1 and End1 were incubated with cell-free HIVenvWITO4160 for 2 hours, trypsinized, and replated for the indicated times. Control cells treated with 50 µM AZT show no rebound of HIV-Gag RNA. E, Integration of HIV-DNA using the Alu-Gag integration assay, fold change over untreated samples. Ect1 and End1 integration correlates with Gag RNA levels observed in (D). Samples showing integration Signal Below Background (S.B.B.) are shown on the graph. (*, **, *** indicate increasing degree of significance).

