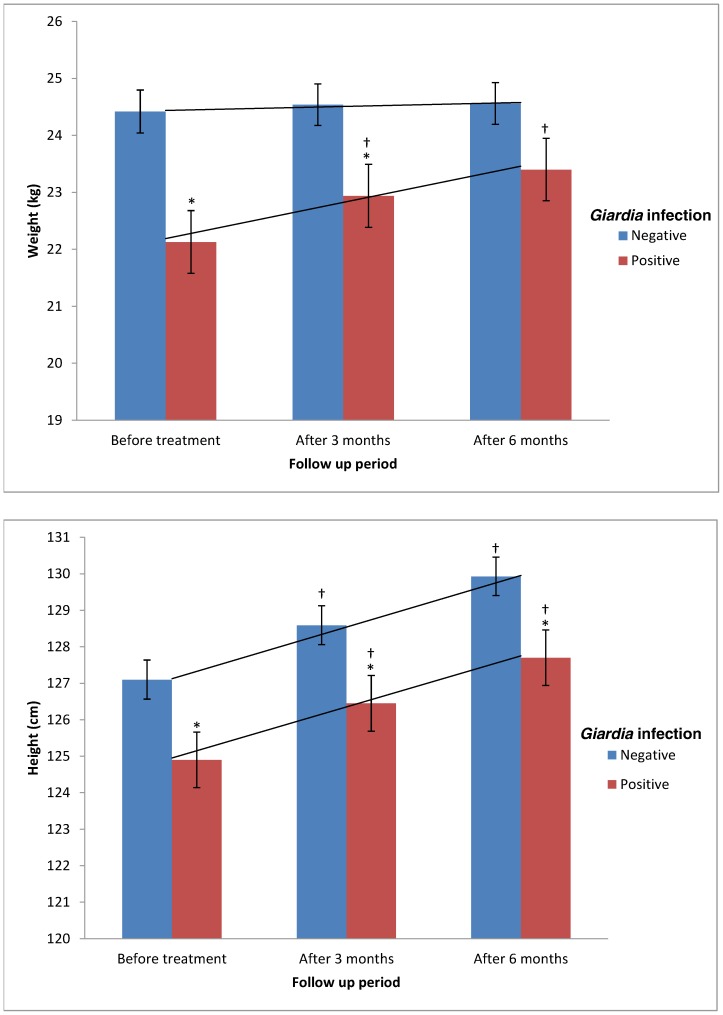
Figure 3. Mean weight and height of children according to Giardia infection over time.
All values are mean (SEM). * Significant difference (lower) compared to non infected group (Independent t-test, P<0.05). † Significant difference (higher) compared to previous assessment (Paired t-test, P<0.05). Trend lines represent the linear weight and height increments (repeated measures ANOVA).

