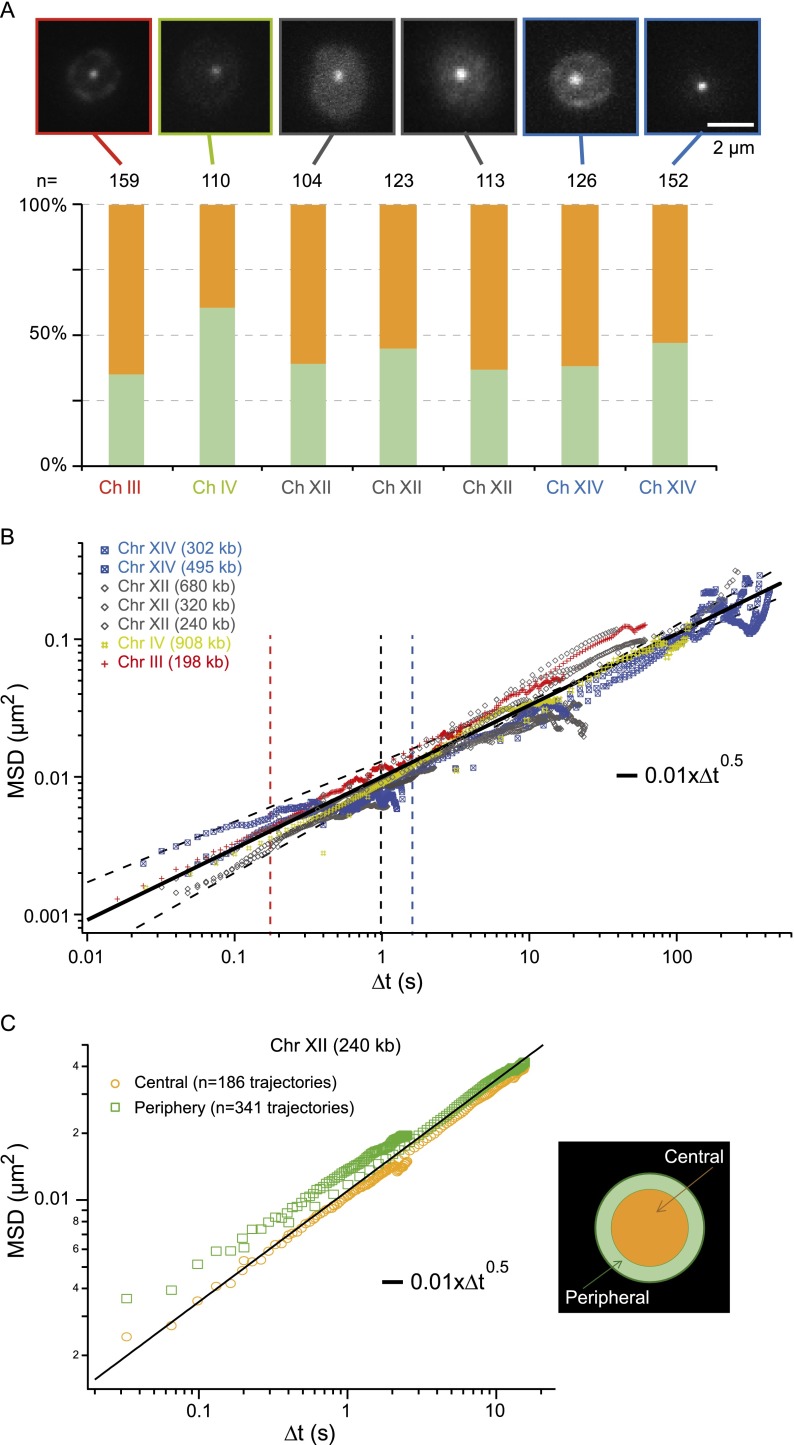
Figure 2.
Chromatin dynamics in living budding yeast. (A, upper panel) Fluorescence micrographs of different yeast strains for interframe intervals of 200 msec (for interframe intervals of 16–50 msec and mutants, see Supplemental Fig. S2); (lower plot) the spatial distribution of these loci in the nuclear volume. (B) The temporal evolution of the MSD for seven different chromatin loci with central localization is plotted over a broad temporal range covering more than four orders of magnitude. These data show a universal behavior characterized by an anomalous diffusive response associated to power low scaling comprised between t0.44 and t0.6 (thin dashed lines). (Black solid line) The Rouse regime, which is associated with an exponent of 0.5 (see details in Fig. 4). Note that each data set is the average over 30–200 trajectories and that we selected tracks with signal-to-noise ratios (SNR) >30 dB. (C) The MSD response for loci with central or peripheral localization is compared (yellow and green data sets, respectively), showing similar dynamics. (Black solid line) The behavior measured in B. The departure of the two curves in the short time regime is associated with the lower SNR of peripheral loci (data not shown).

