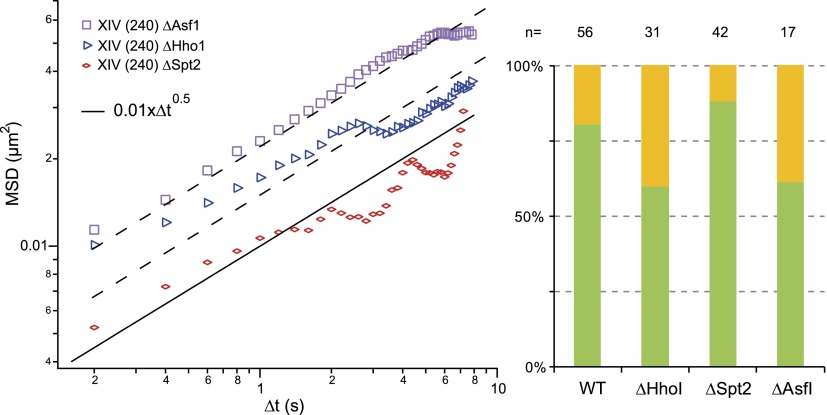
Figure 6.
Chromatin structural/modifying proteins and chromosome dynamics. (Left plot) The MSD temporal evolution for a locus on chromosome XIV, genomic position 240 kb. (Black solid line) The wild-type situation was identical to the Rouse response described in Figure 3A. The dynamic response obtained in hho1 (red symbols), asf1 (blue symbols), and spt2 (purple symbols) mutant yeast. The two dashed lines represent fits to the data with the Rouse model. (Right plot) Asf1p and Hho1p participate in the nuclear localization of the tagged locus (the yellow and green bars correspond to central and peripheral localizations, respectively).

