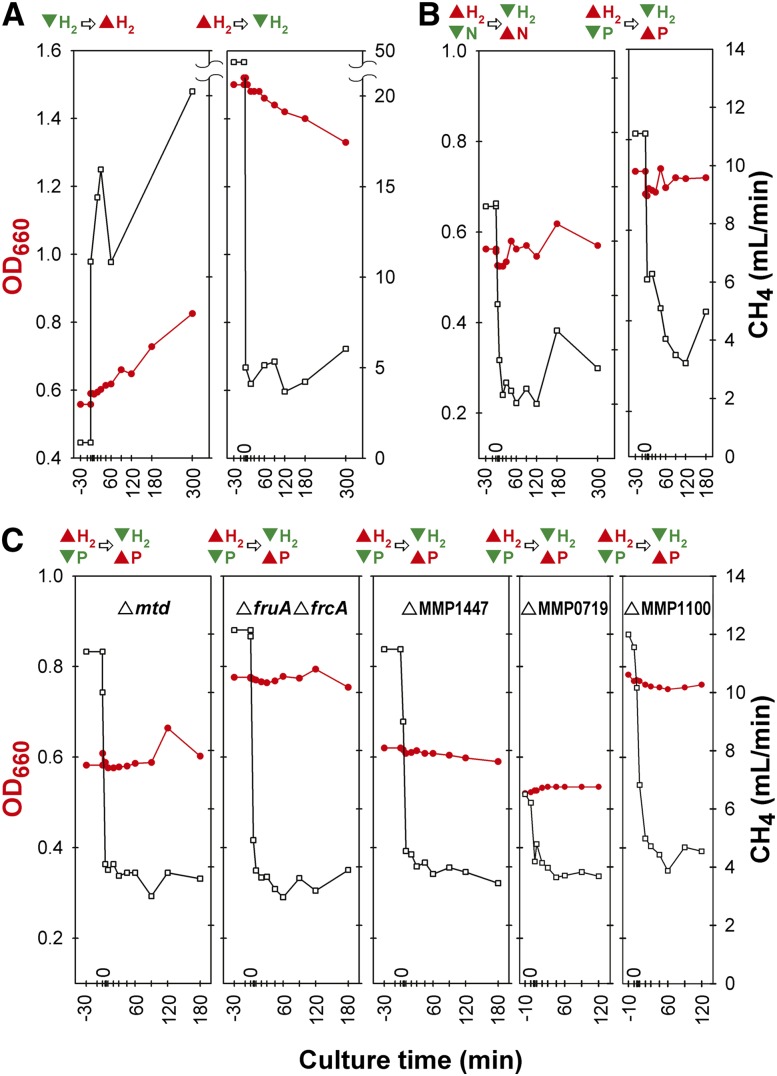
Figure 1.
Chemostats of environmental perturbations for time-series arrays. Four separate growth experiments for time-series array data in chemostats were performed for M. maripaludis MM901 (A,B), and five chemostat runs were performed for gene deletion strains MM901Δmtd, MM901ΔfruAΔfrcA, MM901ΔMMP1447, MM901ΔMMP0719, and MM901ΔMMP1100 (C). Before perturbation, cell cultures were allowed to reach steady state (constant growth rate and cell density). The perturbation for each experiment was as follows: (A) The proportion of H2 in the gas entering the chemostat was rapidly increased from limiting to excess (left) or decreased from excess to limiting (right). (B,C) The proportion of H2 entering the chemostat was rapidly decreased from excess to limiting and, simultaneously, the concentration of ammonium or phosphate was rapidly increased from limiting to excess. Samples were taken 30 min before perturbation, immediately after the perturbation, and after 5, 10, 20, 30, 45, 60, 90, 120, 180, and 300 min. In each plot, culture time is shown on the x-axis, cell density (red line) in OD660 on the left y-axis, and CH4 (black line) in the output gas on the right y-axis. Above each plot, culture conditions before and after perturbation are shown for excess (red triangle) and limiting (inverted green triangle) of a nutrient.

