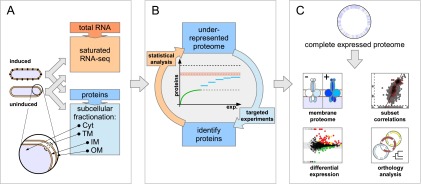
Figure 1.

Overview of the complete expressed proteome discovery workflow. (A) Extraction of RNA and proteins from matched samples, transcriptome analysis. Total RNA and proteins were extracted in parallel from bacteria grown either under uninduced or induced conditions (schematically shown by black knobs representing the VirB/D4 T4SS). Protein extracts were subfractionated into cytoplasmic (Cyt), total membrane (TM), inner (IM), and outer membrane (OM) fractions. To estimate an upper bound for the number of actively transcribed protein-coding genes, the transcriptome was sequenced to saturation using RNA-seq. (B) Analysis-driven experimentation (ADE). In a first pilot phase, samples are analyzed by LC-MS/MS. Underrepresented proteome areas are identified based on a statistical analysis comparing experimentally identified proteins to all expressed proteins (the estimated RNA-seq endpoint indicated by the orange dashed line within an error envelope). All distinct annotated proteins are indicated by the black dashed line. Subsequently, these areas are investigated by targeted experiments, aiming to overcome the saturation trend. (C) Integrative data analysis. Data from the expressed proteome are integrated with genomic, transcriptomics, orthology, and other information to enable further analyses.
