
Figure 3.
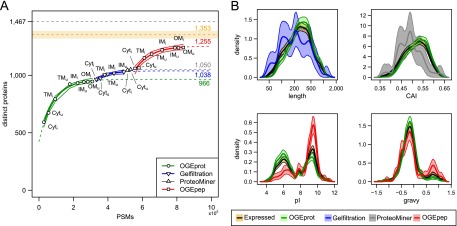
Overcoming the saturation of protein identifications using ADE-guided shotgun proteomics. (A) Increase of distinct identified proteins given the number of PSMs observed in different experiments. We fitted an exponential curve (see Methods) to all experiments for a given biochemical fractionation in order to find a saturation limit (see colored numbers on the right-hand side). We also approximated confidence bands for the fitted points (thin lines; see Methods). The black dashed line at the top signifies the total number of distinct B. henselae proteins (1467); the orange dashed line below represents the estimated RNA-seq endpoint of expressed distinct proteins (1353) including a ±2.5%-error envelope (orange shaded area). (B) Density estimates of four physicochemical protein parameters for different protein subsets. The parameter density for proteins newly identified by the ADE approach is contrasted to that of all expressed proteins (orange) and those identified in pilot experiments using OGEprot (green). The most important aspects of over- or underrepresentation can be seen on the abscissa; they indicate that the targeted experiments successfully add new protein identifications in areas of the proteome that were underrepresented in the pilot experiments. For details on the density estimation and the bootstrap confidence bands (shaded areas), see Supplemental Methods.