
Figure 6.
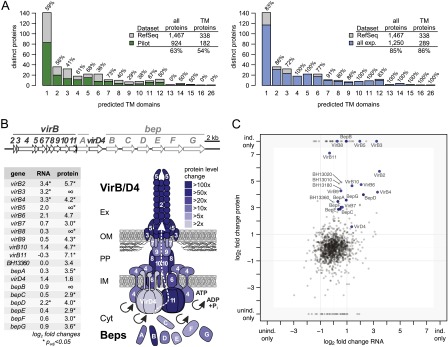
Membrane proteome coverage and dynamics. (A) Comparison of the membrane proteome coverage achieved in four pilot experiments (left panel) and the final data set (right panel). Membrane proteins are binned according to the number of predicted transmembrane domains; the percentage of proteins identified per bin is shown above each bar. The legends summarize the respective coverage achieved comparing the respective data set (pilot phase/final) against all distinct proteins and for the subset of proteins with transmembrane domains. Membrane proteins are underrepresented in the pilot phase but not in the final data set. (B) Transcript and protein expression changes of the virB/D4 T4SS and downstream bep operon. Operon structures (upper panel) are drawn to scale. The lower left panel shows the log2 fold changes at the transcript and protein level for the induced versus uninduced state (the ∞ indicates that the protein was only identified in the induced condition). Fold changes and significance were calculated with DESeq. Regulation at the protein level appears to be more pronounced compared to the transcript level. The lower right panel visualizes the protein expression changes upon induction onto a schematic representation of the assembled VirB/D4 T4SS using different shades of blue. (C) Comparison of expression changes at transcript and protein level. The respective log2 fold changes based on the RPKM values and normalized spectral counts are shown. Members of the VirB/D4 T4SS are shown in blue (BH13360 in light blue), Bartonella effector proteins (Beps) in dark blue. Three proteins that exhibited the most significant differential expression (Supplemental Table S6; Fig. 7) are also shown with their identifiers.