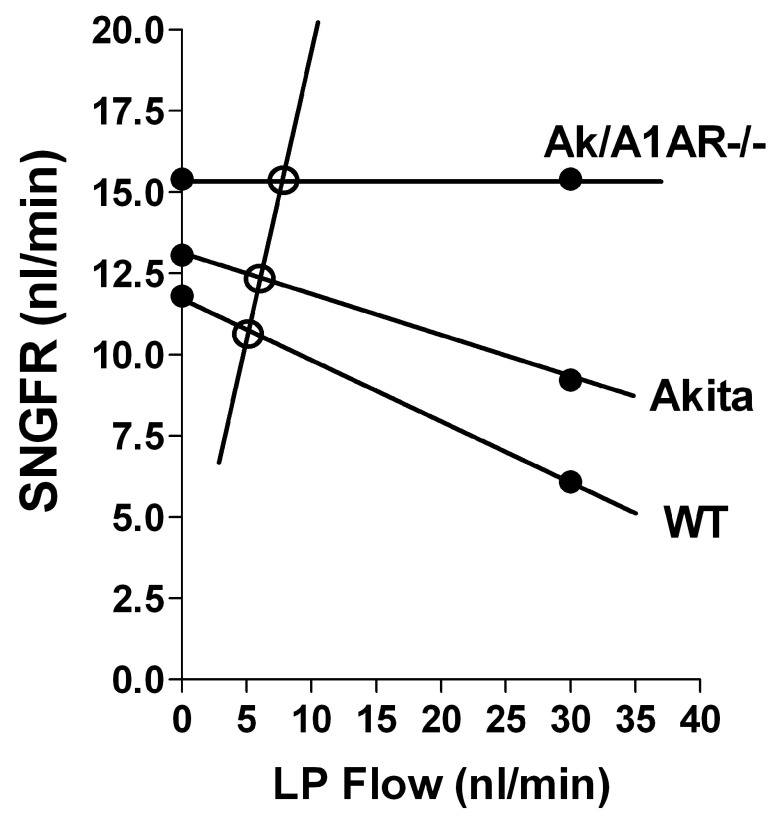
Figure 3. Relationship between the flow rate at the end of the proximal tubule (LP Flow) and SNGFR in wild type (WT), Akita, and Akita/A1AR-/- mice.
SNGFR values (black dots) on the y axis represent SNGFR values from the present experiments; SNGFR values at LP flow of 30 nl/min come from our earlier study in which the effect of raising LP flow on early proximal flow rate was determined 9. The negative lines connecting SNGFRs represent the TGF relationship that, for reasons of simplicity, is drawn as a linear relation, although it is known to be sigmoidal 19, 20. The slope of the positive line reflects proximal reabsorption, and it was calculated assuming a TF/Piothalamate ratio of 2. The intersects between the TGF and reabsorption relationships indicated by the open circles represent steady-state values for reabsorption and SNGFR 19.

