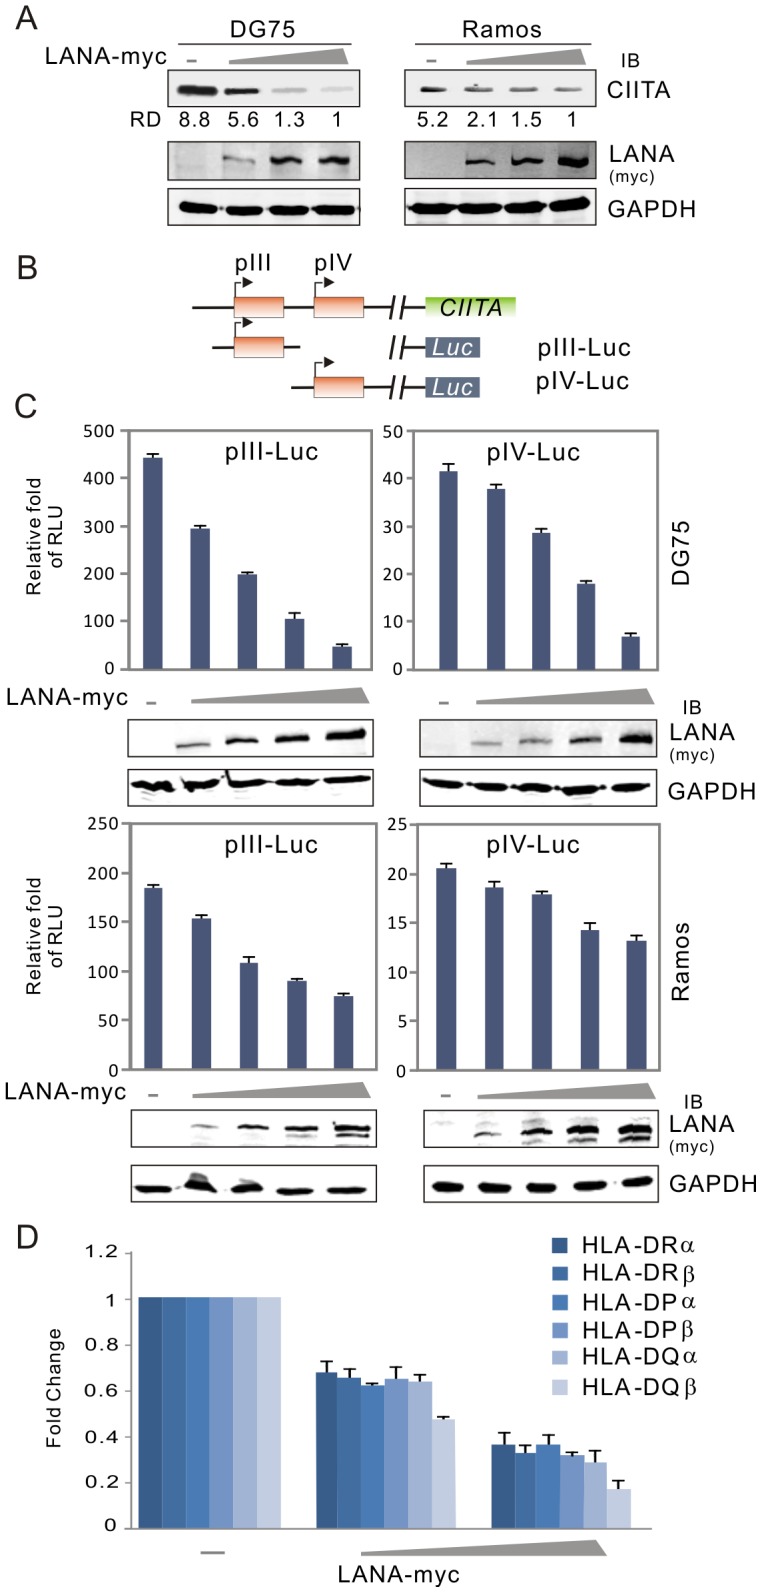
Figure 3. LANA expression represses CIITA expression in B lymphoma cells.

(A) The level of CIITA expression was reduced by LANA in a dose-dependent manner. Ten million of DG75 or Ramos cells were transfected with a different dose of DNA construct expressing LANA. At 24 hr post-transfection, cells were harvested and lysed for immunoblotting assays as indicated in the figure. GAPDH blot was used as loading control. The relative density (RD) of CIITA proteins was quantified and shown in the figure. (B) Schematic representation of CIITA promoter reporters (pIII-Luc and pIV-Luc) with luciferase. (C) DG75 and Ramos cells were individually co-transfected CIITA promoter (pIII and pIV) driving luciferase reporter plasmid with either pA3M-LANA or pA3M vector. At 24-hrs post-transfection, cells were harvested and subjected to reporter assay. The results were presented by the RLU (relative luciferase unit) fold compared to pGL3-basic with vector alone. Data is presented as means±SD of three independent experiments. The expression of LANA were detected by immunoblotting and shown at the bottom panels. (D) Quantitative real-time PCR analysis of MHCII in DG75 cells transfected with different dose LANA as in panel A.
