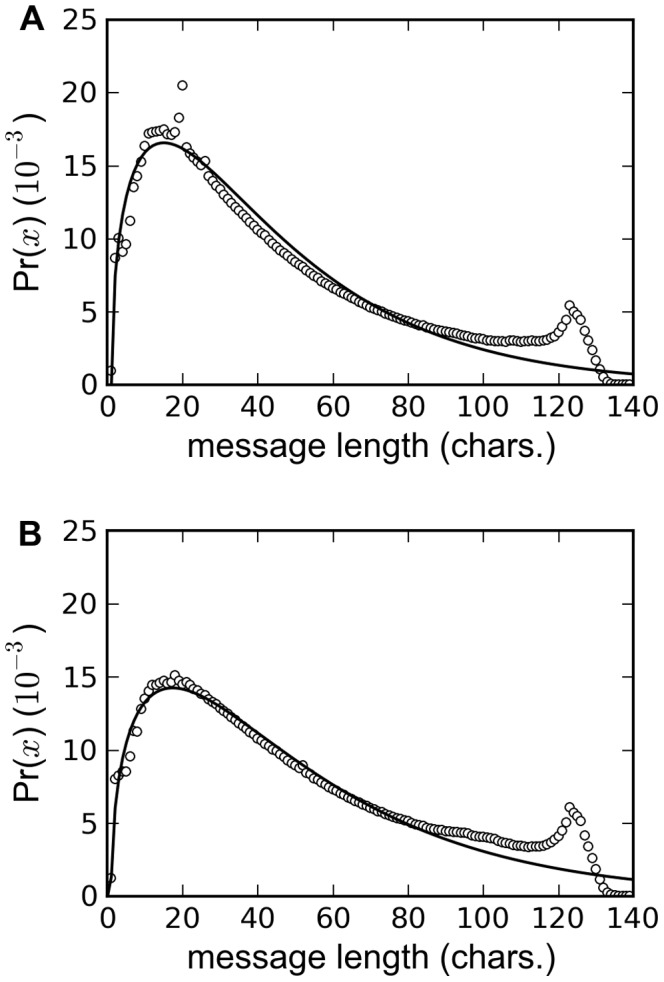
Figure 1. Utterance length distribution of the entire dataset.

A. Unfiltered utterance length distribution of the entire dataset B. Utterance length distribution of English tweets with URLs and LOL removed. The solid line in both plots is the best fit of Eq. (1).
