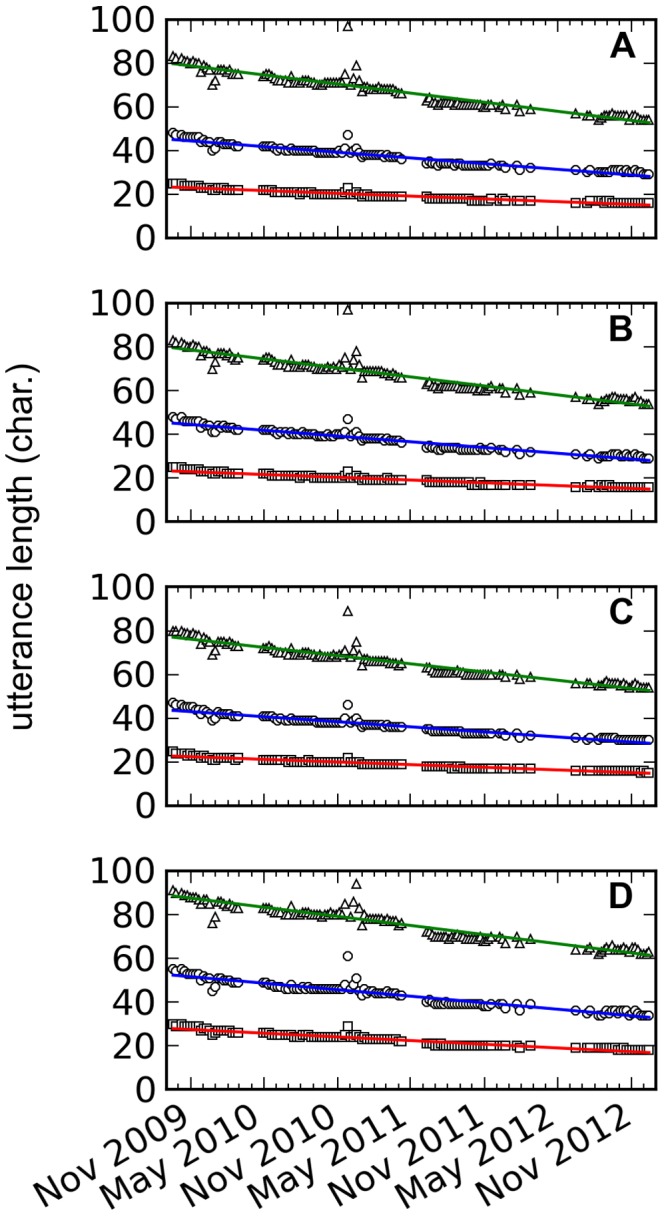
Figure 3. Utterance length distribution over time.

First quartile Q1 (square), median Q2 (circle) and third quartile Q3 (triangle) of the A. original dataset, B. after resampling into  utterances per day, C. removing URLs and D. restricting to English tweets.
