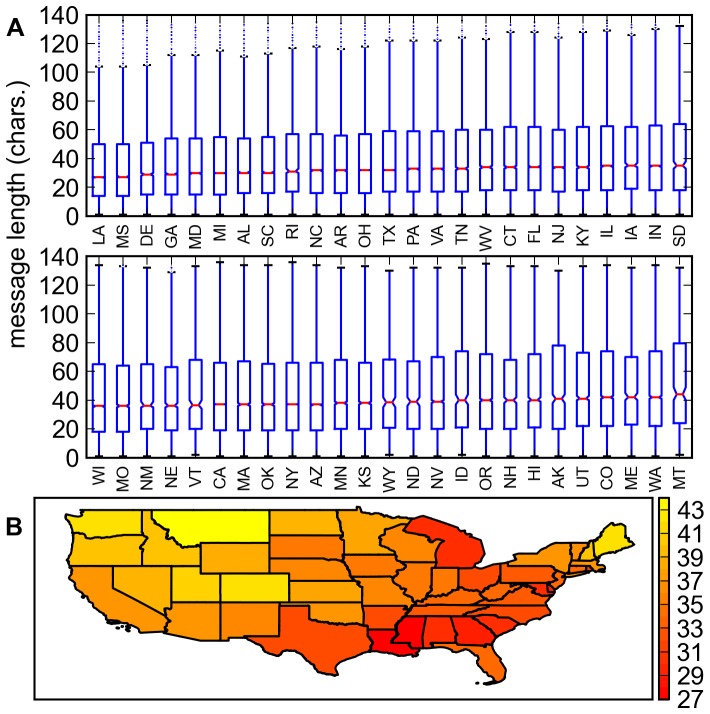
Figure 6. Utterance lengths across US states.
A. Box plot of the utterance length distribution of each US state sorted by increasing median utterance length. The notches were estimated using 10,000 bootstrap repetitions but the resulting bootstrapped median values are the same as the empirical median values B. Contiguous US states colored with the bootstrapped median utterance length.

