
Fig. 1.
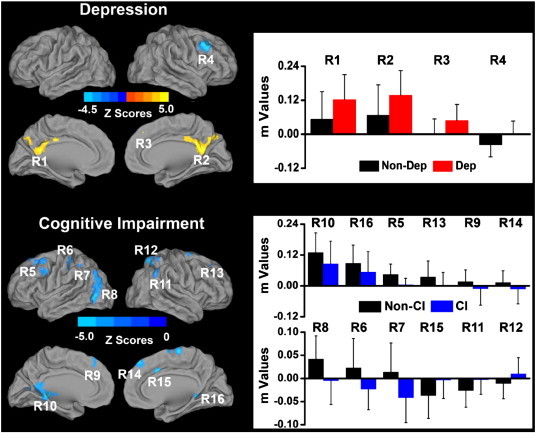
Main effects of depression and mild cognitive impairment on the left hippocampal functional connectivity (LHFC) networks across all subjects (p < 0.05, AlphaSim correction). Left: Brain regions with significant main effects of depression and cognitive impairment on the LHFC network. Bright color indicates increased connectivity and blue color indicates decreased connectivity. Color bar is presented with z scores. Right: Numerical representation of significant main effects of depression and mild cognitive impairment on the LHFC network (m is z value from the cross-correlation coefficient after Fisher's z transformed, same below). Abbreviations: Non-Dep: no depression; Dep: depression; Non-CI: no amnestic mild cognitive impairment; CI: amnestic mild cognitive impairment. R1: left posterior cingulate cortex/precuneus (LPCC/Pcu); R2: right posterior cingulate cortex/precuneus (RPCC/Pcu); R3: right dorsomedial prefrontal cortex (RDMPFC); R4: right dorsolateral prefrontal cortex (RDLPFC); R5: left dorsolateral prefrontal cortex (LDLPFC); R6: left postcentral gyrus; R7: left inferior parietal cortex (LIPC); R8: left posterior middle temporal gyrus (LpMTG); R9: left dorsomedial prefrontal cortex (LDMPFC); R10: left retrosplenial cortex (LRSC); R11: right inferior parietal cortex (RIPC); R12: right superior parietal cortex (RSPC); R13: right dorsolateral prefrontal cortex (RDLPFC); R14: right dorsomedial prefrontal cortex (RDMPFC); R15: right dorsal cingulate cortex (RdACC); R16: right retrosplenial cortex (RRSC). (For interpretation of the references to color in this figure legend, the reader is referred to the web version of this article.)