
Fig. 2.
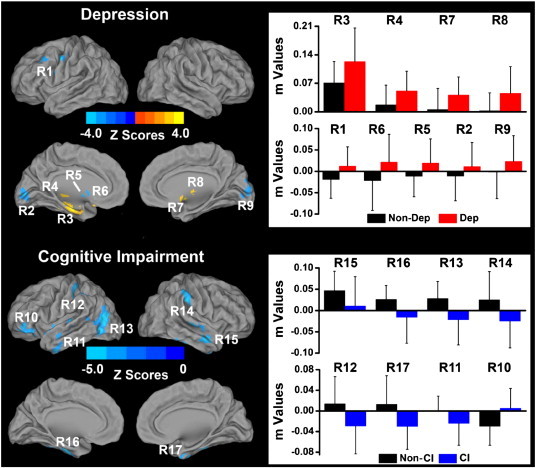
Main effects of depression and mild cognitive impairment on the right hippocampal functional connectivity (RHFC) networks across all subjects (p < 0.05, AlphaSim correction). Left: Brain regions with significant main effects of depression and mild cognitive impairment on the RHFC network. Bright color indicates increased connectivity and blue color indicates decreased connectivity. Color bar is presented with z scores. Right: Numerical representation of significant main effects of depression and mild cognitive impairment on the RHFC network. Abbreviations: Non-Dep: no depression; Dep: depression; Non-CI: no amnestic mild cognitive impairment; CI: amnestic mild cognitive impairment. R1: left dorsolateral prefrontal cortex (LDLPFC); R2: left middle occipital gyrus (LMOG); R3: left hippocampus; R4: left thalamus; R5: left putamen; R6: left caudate; R7: right lentiform nucleus; R8: right thalamus; R9: right middle occipital gyrus (RMOG); R10: left ventrolateral prefrontal cortex (LvlPFC); R11: left anterior temporal pole (LaTP); R12: left inferior parietal cortex (LIPC); R13: left posterior middle temporal gyrus (LpMTG); R14: right supramarginal gyrus/inferior parietal cortex; R15: right anterior temporal pole (RaTP); R16: left parahippocampal gyrus (LPHG); R17: right inferior temporal cortex (RITG). (For interpretation of the references to color in this figure legend, the reader is referred to the web version of this article.)