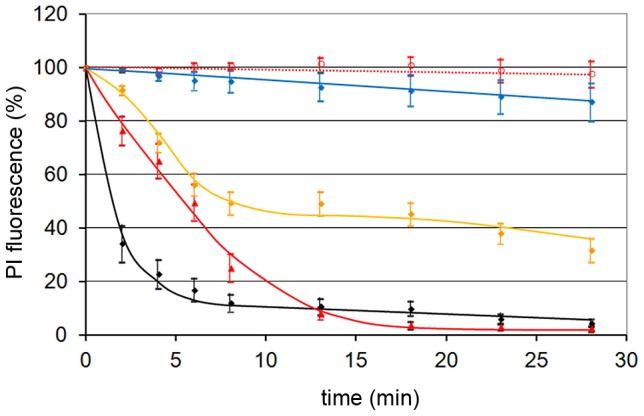
Figure 4. NEBD capacity of different PV.

Per permeabilized HeLa cell 300 of each PV were added. The figure shows the quantification of the PI stain as in figure 2B, and the 95% CIs at each time point. Red dotted line: buffer only (n = 14). Blue line: AAV2 (n = 13), orange line: canine parvovirus (n = 35), red line: H1 (n = 23), black line: AAV2 after acidification to pH 5.2 and subsequent neutralization (n = 10). Acidification to pH 5.2 of H1 did not change the NEBD activity (not shown). The figure shows that NEBD is independent upon the type of PV with a similar kinetic but to a different extent. Acidification was needed for AAV but not for H1 and the canine parvovirus.
