
Fig. 4.
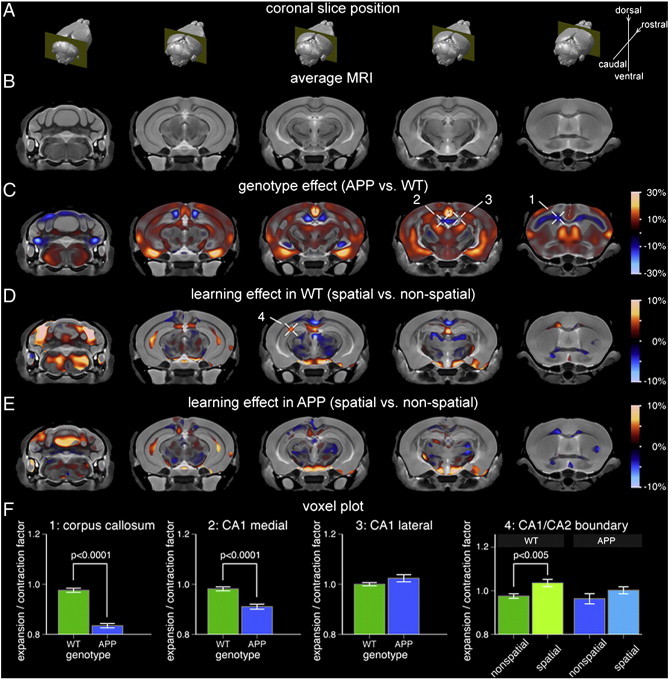
Focal hippocampal volume increase associated with spatial learning and memory in WT mice is attenuated in APP mice. (A) Location of the five MRI slices shown in reference to the 3D brain. (B) Population-specific 3D MRI brain atlas. (C) Effect of genotype on local brain volume. Warm colors correspond to regions where APP brains were larger than WT whereas cool colors indicate regions that were smaller. The expansion/contraction map is masked based on statistical significance at a false discovery rate (FDR) of 10%. Cross-hairs 1 and 2 point to specific areas that are smaller in APP brains compared to WT, namely, the corpus callosum/cingulum bundle and the midline-adjacent CA1 regions, respectively. Cross-hair 3 points to an area of no change, specifically, the lateral CA1 region. (D) Expansion/contraction associated with spatial vs. non-spatial learning and memory in WT mice (masked at 10% FDR). Cross-hair 4 points to volume increase in the CA1/CA2 boundary region. (E) Expansion/contraction associated with spatial vs. non-spatial learning and memory in APP mice (same significance mask as in (D)). Compared to WT mice, APP mice display attenuated hippocampal volume increase following spatial Morris Water Maze performance. (F) The bar graphs show mean and standard error for the expansion/contraction factor associated with each selected voxel (cross-hairs c1–3 and d4). The genotype plots (1–3) have been normalized such that the WT homecage controls have a factor of 1.0. The training effect plots (4) have been normalized such that the homecage controls for respective genotypes have a factor of 1.0. WT: wild-type.