
Fig. 6.
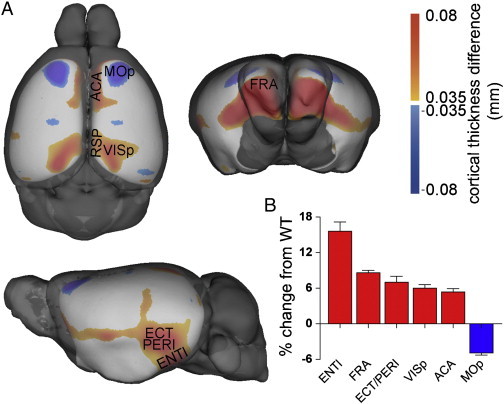
Cortical thickness differences by genotype. (A) F-Statistic maps were thresholded at a false discovery rate of 5%.  is APP > WT,
  is WT > APP. Thickness differences max out at 0.1 mm. (B) Percent change in cortical thickness of six regions in APP mice compared to WT controls. ENTl: entorhinal cortex (lateral part), FRA: frontal association cortex, ECT/PERI: ectorhinal/perirhinal cortex, VISp: primary visual cortex, ACA: anterior cingulate cortex, MOp: primary motor cortex, RSP: retrosplenial cortex, WT: wild-type. Brain structure abbreviations used are from the Mouse Allen Reference Atlas available online at http://www.brain-map.org.