Figure 4.
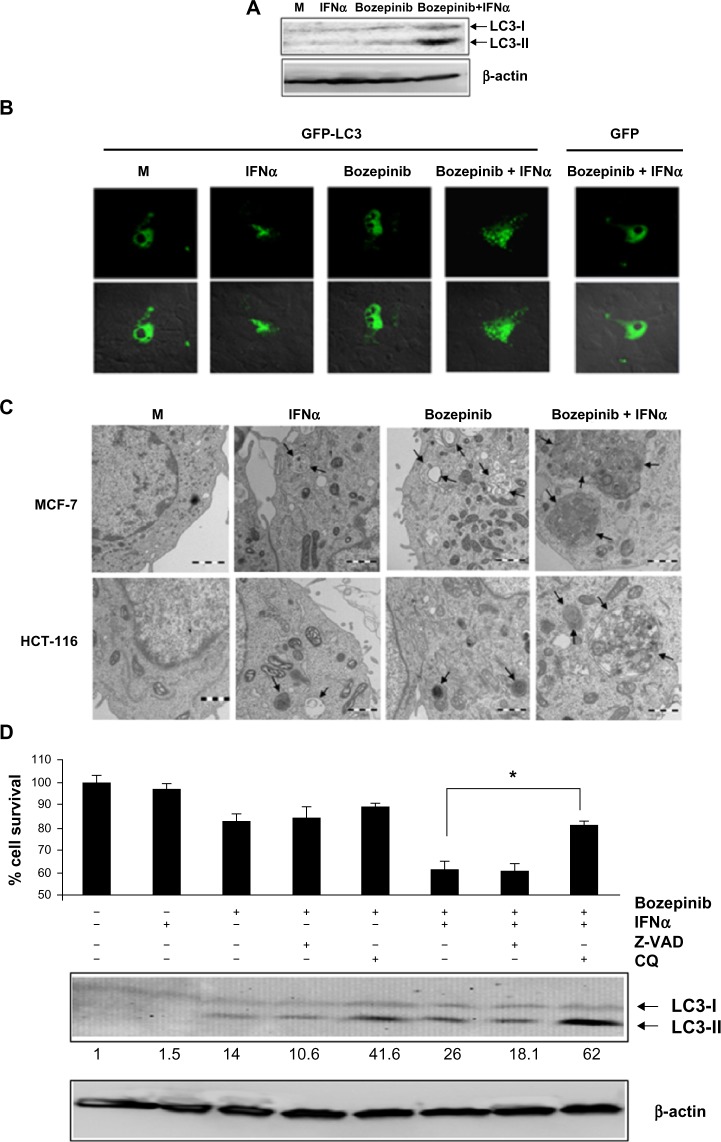
Bozepinib induced LC3-autophagosome formation that was strongly enhanced when combined with IFNα. (A) MCF-7 cells were mock-treated or treated with 5 µM bozepinib, 500 IU/mL human IFNα, or a combination of bozepinib/IFNα for 48 hours. Total proteins were extracted for immunoblot analysis using anti-LC3 and anti-β-actin antibodies. (B) MCF-7 cells were plated on cover slips supported in six-well plates and transfected with 5 μg of GFP-LC3 or GFP-control plasmids as described in the Materials and methods section. After 24 hours, the cells were treated with 5 µM bozepinib, 500 IU/mL human IFNα, or a combination of bozepinib/IFNα for 48 hours. Cells were fixed and visualized using a Radiance 2000 confocal microscope. (C) MCF-7 and HCT-116 cells were mock-treated or treated with 5 µM bozepinib, 500 IU/mL human IFNα, or a combination of bozepinib/IFNα for 48 hours. Cells were fixed and prepared for visualization by transmission electron microscopy as described in the Materials and methods section. Transmission electron microscopy images show that the treated cells included typical autophagolysosomes (arrows) containing organelles and lamellar structures. (D) MCF-7 cells were treated with 20 μM of chloroquine or 25 μM of Z-VAD inhibitors 2 hours before 5 μM bozepinib, 500 IU/mL IFNα, or a combination of bozepinib/IFNα. After 48 hours, the cells were treated with a Cell Counting Kit-8, measured at 450 nm optical density and represented as described in the Materials and methods section. Total proteins were extracted for immunoblot analysis using anti-LC3 and anti-β-actin antibodies. *P<0.05 (t-test). Western blot signals were quantified using Image J software, and relative β-actin-normalized values were assigned in reference to nontreated cells (value 1).
Abbreviations: CQ, chloroquine; IFNα, interferon-alpha; M, mock treated cells.

