
FIGURE 6.
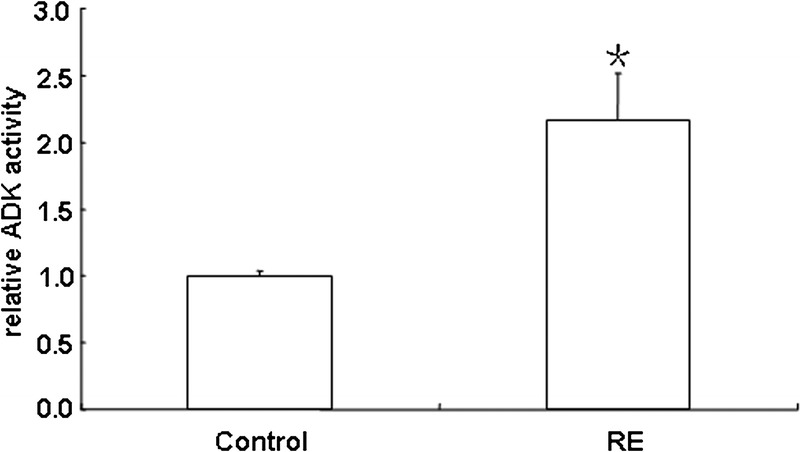
Adenosine kinase enzyme activity measured using an enzyme-coupled bioluminescent assay. The results were normalized to the ADK activity found in control samples and expressed as mean ± SEM of RE (n = 3), control cortex (n = 3); * p < 0.05 vs control.