
Fig. 2.
Comparison using the three different modes of transmission (MoT) models for the projected distribution of new HIV infections in the population.
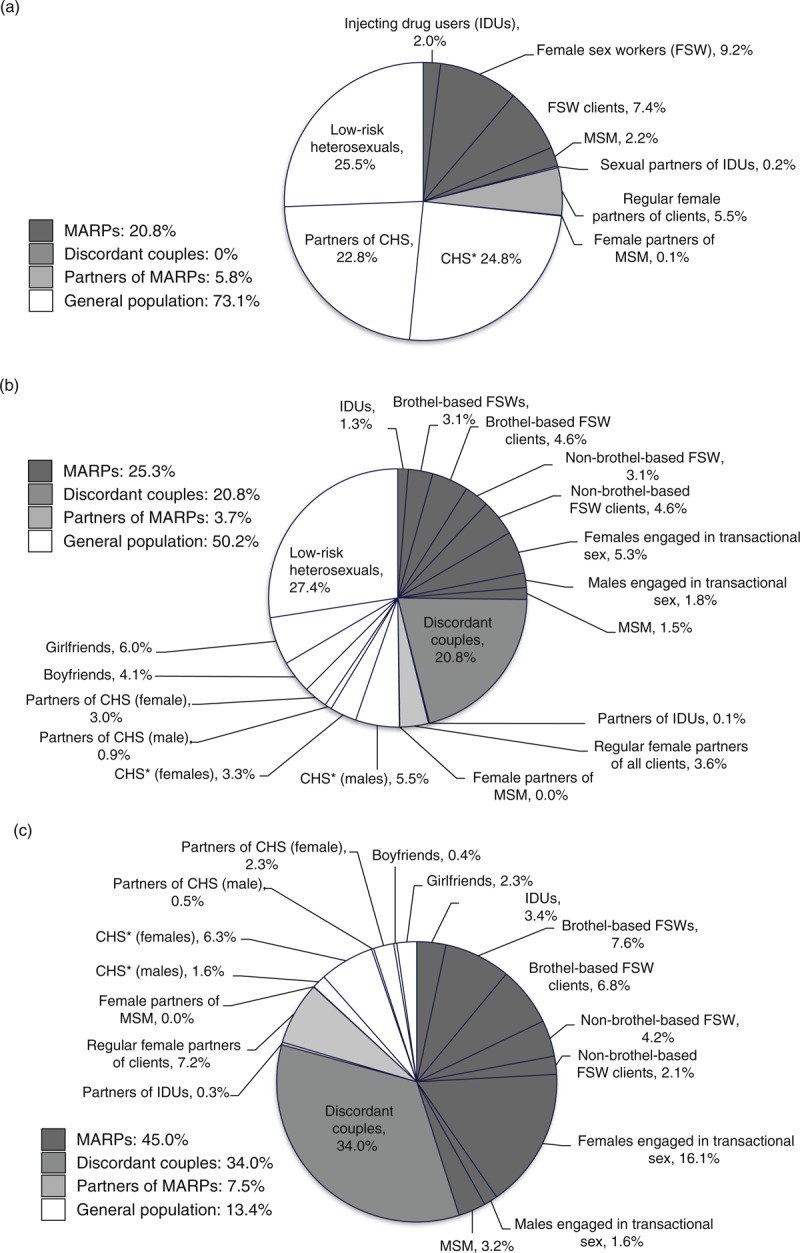
(a) shows results from the original MoT model, (b) displays results from the intermediate MoT model and (c) illustrates modelling projections for the revised MoT model. ∗CHS, casual heterosexual sex.