
Fig. 2.
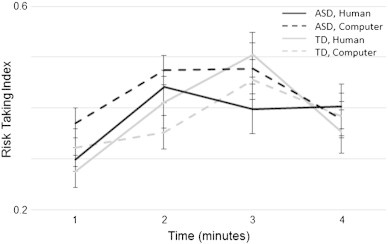
Players' choices as a function of time. Risk-Taking Index (number of non-match choices divided by the total number of non-match and match choices when both are available to the player) for games played against human- (solid lines) and computer- (dashed lines) opponent are plotted for each minute of the game (averaged for all games) for individuals with ASDs (black lines) and healthy controls (gray lines). There was a significant main effect for time (F(1,3) = 6.3, p = 0.002) but not for opponent type or group.