
Fig. 3.
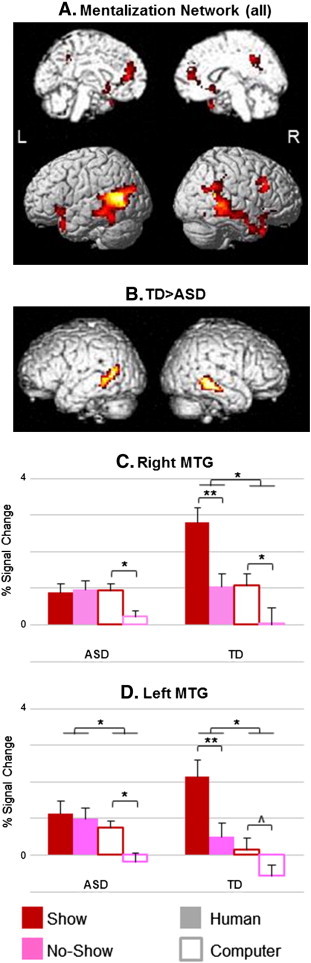
Mentalizing network. Panel A depicts the activation map of a mixed-effects ANOVA showing brain regions with a significant effect of Opponent's Response in the Human-Opponent runs (Show > No-Show) and Opponent Type in all participants (n = 27, qFDR < 0.05). These regions included the temporoparietal junction (TPJ), temporal pole (TP), medial prefrontal cortex (MPFC), posterior cingulate cortex (PCC), ventrolateral prefrontal cortex (VLPFC), fusiform gyrus (FG) and putamen. Panel B shows the map of brain areas exhibiting an interaction between Human Show vs. No-Show events and Group, masked with the mentalizing network as presented in panel A. Bilateral MTGexhibited a significant effect such that controls showed a greater response to Show vs. No-Show compared to individuals with ASDs (left MTG Pcluster = 0.03 FWE, right MTG Pcluster = 0.04 FWE; for presentation purposes, clusters are shown at a threshold of P < 0.05 uncorrected, k = 20). Percent signal change of the different events in these regions are shown in Panels C & D. **p < 0.001; *p < 0.05; ^p = 0.06; L = left; R = right hemisphere.