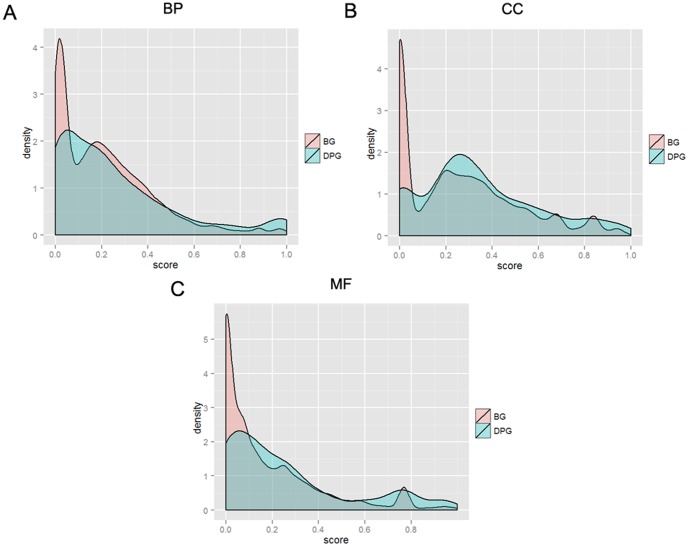
Figure 1. Comparison of GO similarity between DPGs and random gene pairs.
Frequence distributions of GO similarity score on biological process (BP, A), cell component (CC, B), and molecular function (MF, C). The blue and red lines depict frequency distributions of DPGs and the randomly sampled gene pairs, respectively.

