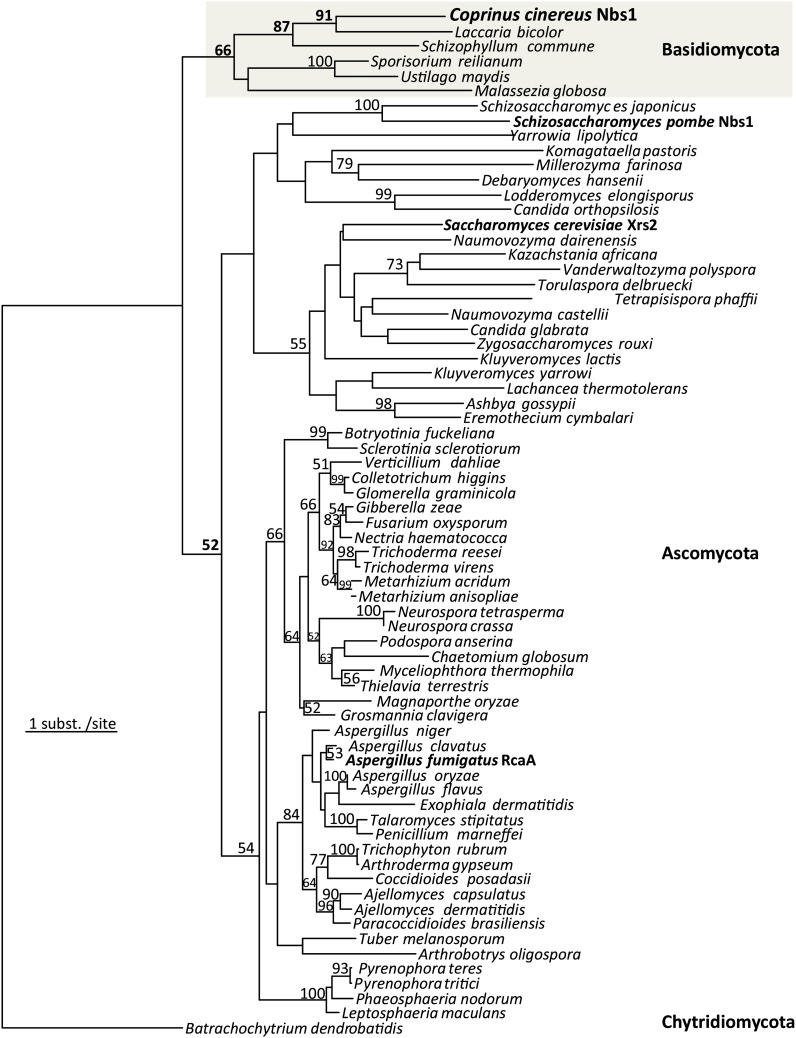
Figure 1.
Phylogenetic tree showing the evolutionary relationships among fungal orthologs of nbs1. C. cinereus Nbs1 groups with its closest relative Laccaria and with other Basidiomycetes. Numbers at the base of branches are the percent bootstrap support ≥50%, which is a measure of support for the branch. The scale bar represents the distance of one amino acid substitution per site; 186 aligned amino acid sites were analyzed using the LG+25γ substitution model implemented in RAxML version 7.3.1 (Stamatakis 2006; Stamatakis 2008), resulting in this tree with an optimized LnL of −20412.06. The parameter describing the γ-distributed amino acid substitution frequencies is α = 1.42. Sequence accession numbers and the position of C. cinereus Nbs1 relative to all other eukaryotic homologs are given in Figure S4.

