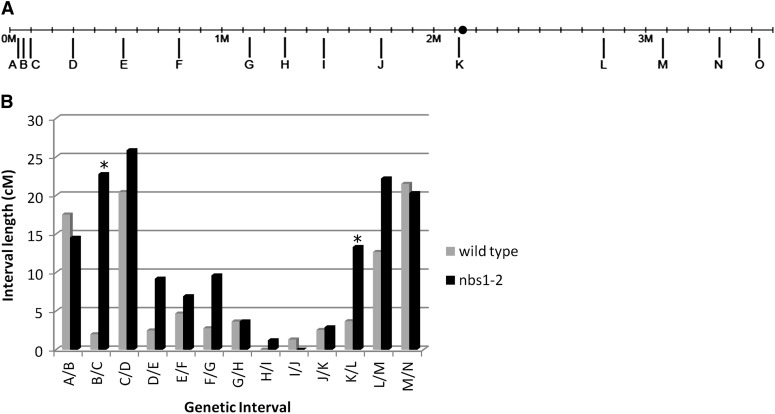
Figure 4.
Genetic map of chromosome 3. (A) Location of SSRs, SNPs, and insertion-deletion polymorphisms used for genetic mapping of chromosome 3. Long tick marks below the line represent location of markers. The ● marks the centromere location (Stajich et al. 2010). (B) Map lengths of individual intervals along chromosome 3 of wild-type (gray) and nbs1-2 (black). *Statistically significant intervals. Total map length is significantly different (P < 0.05).

